

📝 Availability: NextTables for SAP BW, Professional and Enterprise editions.
You will learn
How to get data out of a NextTables table: the two export formats, the clipboard route, and pivot mode, which summarizes a table before you take it anywhere.
This article is for anyone who works with a NextTables table in SAP BW and needs its contents in a spreadsheet, or needs a total per group instead of every single row.
Prerequisites
- A configured table you can open in NextTables.
- Export enabled for the table. Suppress Export in the table properties disables the export functions for the whole table, and the same setting on a single column excludes that field from all exports. Both are described in Table and column configuration in NextTables for SAP BW.
- Nothing else for pivot mode. Its controls sit in the Columns side panel of the table.
What an export contains
An export follows the table in front of you. The rows the grid currently holds are the rows that land in the file, so your filters and the row limit decide the size of the export.
For the columns, the display of each field decides. A field that the grid shows as key only exports as one column. A field that the grid shows with its text exports as two columns: the key, then the field as the grid shows it, for example 1 and Salary (1). Every column of a field carries its label and the technical field name in square brackets, for example Cost type [/BIC/ZKSTAR]; the text column next to it carries the label alone. The Excel file and the CSV file have the same columns in the same order, and columns set to Suppress Export are left out.
When a table holds more rows than it loaded, the top row of the table toolbar carries a row limit field next to Filters, marked with a yellow exclamation mark. Hover it and it reports how much of the table is loaded, for example 1000 rows out of a total of 11238 are displayed. The table opens with the number set in Max Rows in the table configuration, and you can type a higher number into the field and press Enter to load more. Read the field before every export: a table showing 1000 of 11238 rows exports 1000 rows.
Filter the table down to the rows you want before you export. The filters are covered in How to filter, sort and arrange columns in NextTables.
Step-by-Step Instructions
1. Check the row count
Open the table and look at the row limit field in the top row of the toolbar. If it shows fewer rows than the table holds, apply a filter so the rows you want are among the ones loaded, or raise the number in the field.
2. Export to Excel
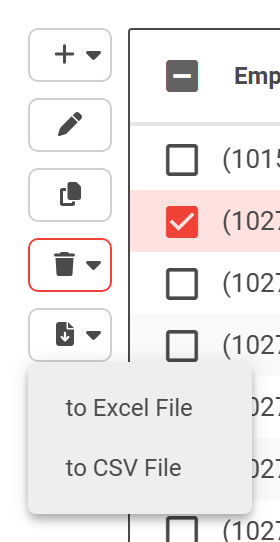
Open the download icon in the left column of the table toolbar. It opens a menu with two entries. Choose to Excel File and the browser downloads the current contents of the table as a spreadsheet.
3. Export to CSV
Choose to CSV File from the same menu for a plain text file. Use this one when the data goes into another system rather than to a person.
The CSV file follows the Import block of your user profile: dates in its date format, decimal numbers with its decimal separator, and its delimiter between the columns. Numbers carry no thousands separator. With the date format DD.MM.YYYY, a comma as decimal separator and a semicolon as delimiter, the file holds values such as 01.01.2010 and 22,4, separated by semicolons; with YYYY-MM-DD, a point and a comma, the same values read 2010-01-01 and 22.4, separated by commas. That is the format the import reads with Use profile settings. The CSV exports of a master-item screen keep a fixed format: a comma between the columns, dates as YYYY-MM-DD and a point as decimal separator.
4. Copy rows to the clipboard
For a handful of rows, the clipboard is faster than a file. Select the rows in the grid and open the context menu with a right-click. It carries Copy selected rows with header, which puts the column headers in front of the data so the target spreadsheet has labels. The neighboring entries are Copy selected rows and Copy selected range.
Paste into Excel and the rows arrive as columns.
💡 Tip: The clipboard route is the quick alternative when you want to check a few rows against another list. For a whole table, use the export, which produces a file you can keep.
5. Switch on pivot mode
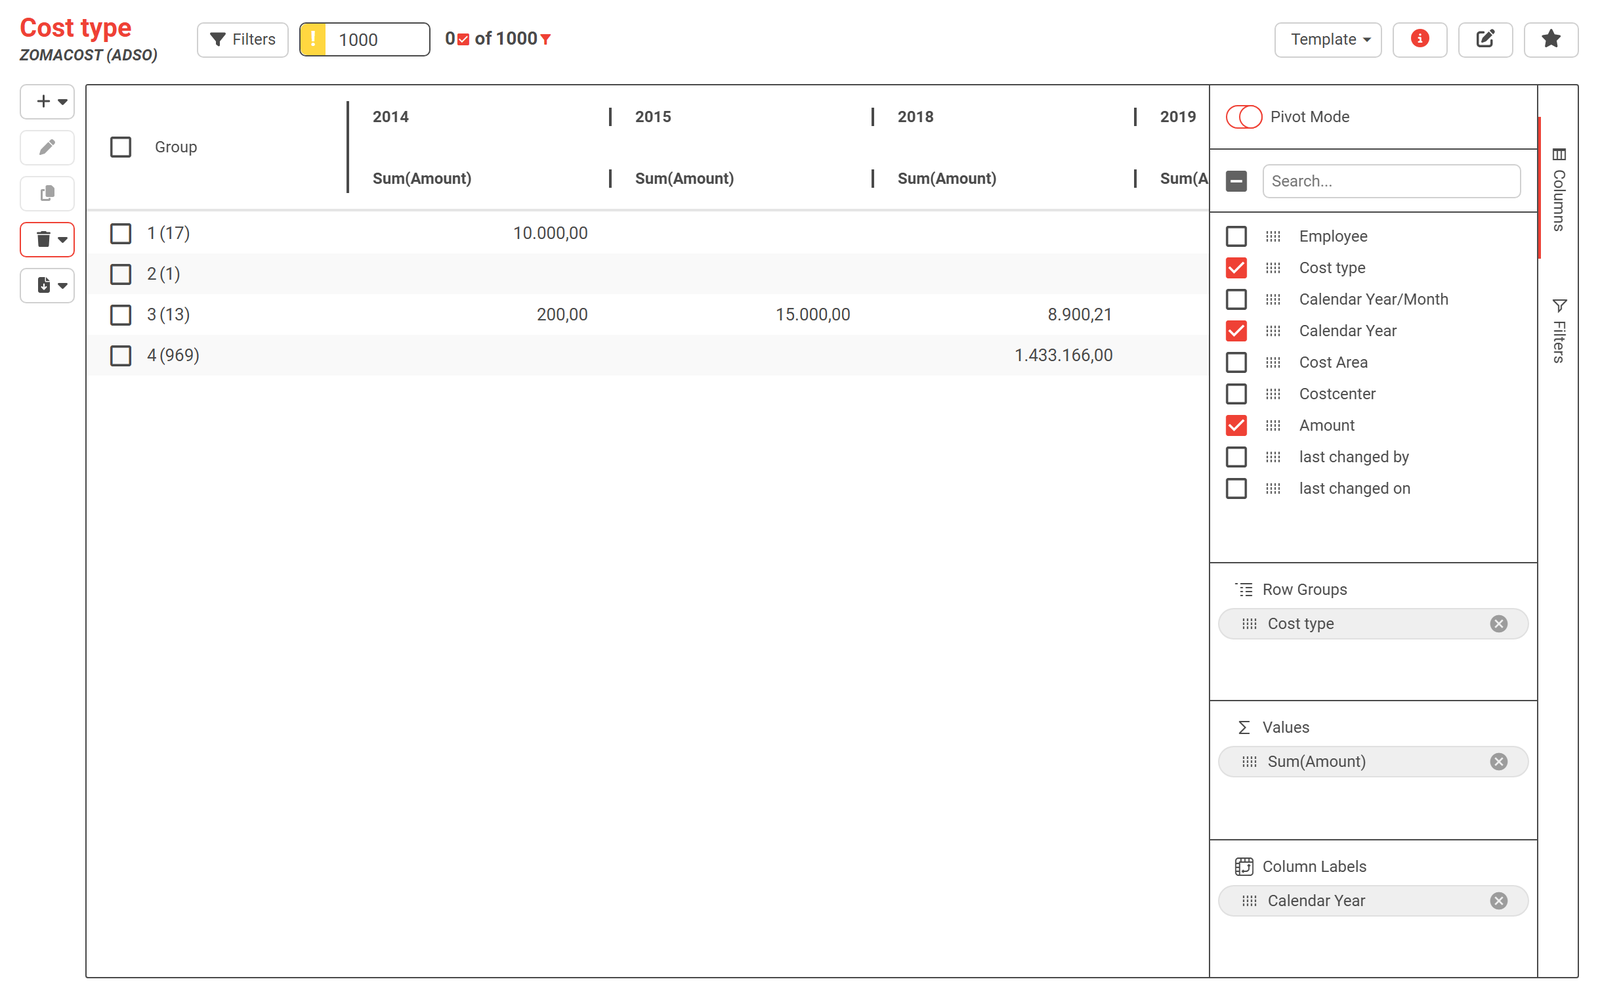
Open the Columns side panel on the right edge of the table. The panel holds a Pivot Mode toggle, the list of columns, and the drop zones that build the summary. Switch Pivot Mode on.
📝 Note: A pivot is a way of reading the table inside NextTables. The rows in SAP BW stay exactly as they are. Switching Pivot Mode off returns you to the flat table with nothing changed.
6. Set the row groups
Drag a column into Row Groups, the zone labeled Drag here to set row groups. Every distinct value of that column becomes one line of the summary. Drag a second column in below the first to break each line down further.
The same grouping is available from a column's own menu, which carries Group by <column> and Un-Group by <column>. Use Expand All and Close All in that menu to open or collapse the groups.
7. Set the column labels
Drag a column into Column Labels, the zone labeled Drag here to set column labels. Its values spread across the top of the table, one column each. This zone appears once Pivot Mode is on. Leave it empty and you get a plain grouped list rather than a cross-table.
8. Add the values to aggregate
Drag the field you want to total into Values, the zone labeled Drag here to aggregate. This is the number the pivot calculates for every combination of row group and column label. Several fields can sit in the zone at once, each with its own aggregation.
9. Choose the aggregation
Open the column menu of an aggregated column and choose Value Aggregation. Seven aggregations are available, listed below. Sum is the usual choice for a key figure; Count answers how many rows sit behind a group.
10. Export the summary
Export from pivot mode the same way as from the flat table: the download icon, then to Excel File or to CSV File. Because the export follows what the table shows, you receive the summary rather than the underlying rows. Check the row limit field one more time before you do it, since the pivot summarizes only the rows the grid has loaded.
The aggregations
| Aggregation | What it returns for each group |
|---|---|
| Sum | The values added together |
| Min | The smallest value |
| Max | The largest value |
| Count | How many entries the group contains |
| Average | The mean of the values |
| First | The first value in the group |
| Last | The last value in the group |
Set them per column with Value Aggregation in the column menu, so a pivot can total one field and count another at the same time.
Getting back to the flat table
Switch Pivot Mode off in the Columns panel. The drop zones keep what you put in them, so switching pivot mode on again brings the same summary back within the session. To clear the arrangement completely, use Reset Columns in a column menu.
If you want to keep a filtered and arranged view for next time, save it as a template. That is covered in How to save and share a view with templates in NextTables.
Export, change and import back
A CSV export of a table imports back into the same table. That makes an export the safest starting point when you want to change many existing rows: export them, change the values in the file, and import the file into the same table.
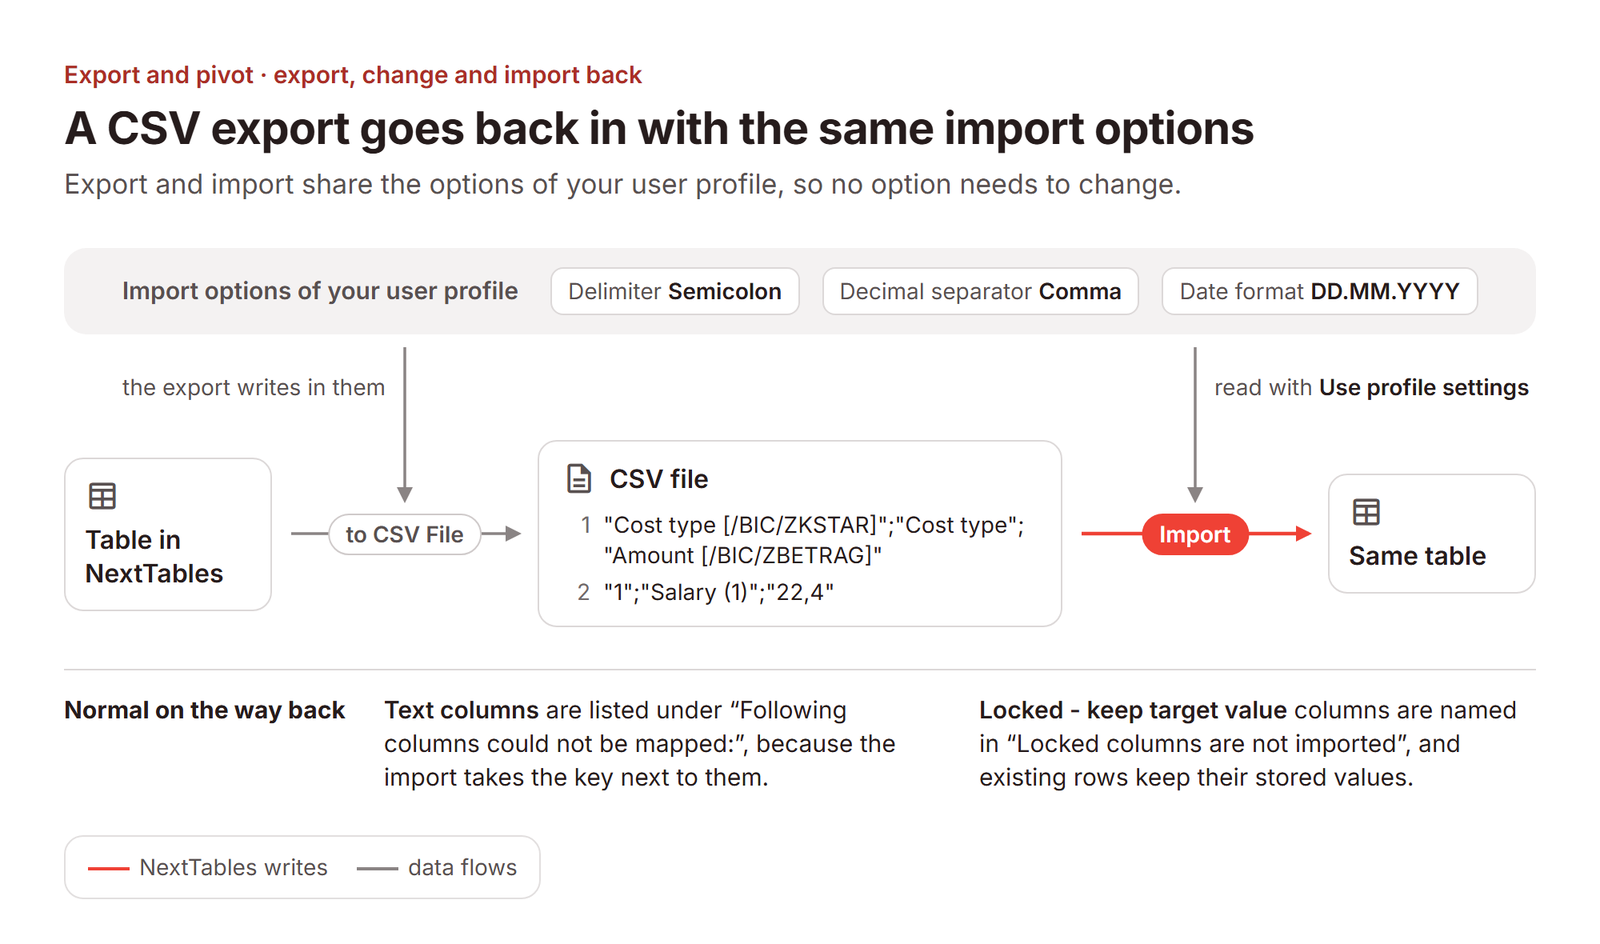
- CSV file. Import it with Use profile settings switched on, which is how the import opens. The file is written in the format of your profile, so no option needs to change. For a file exported by someone with other import settings, switch the option off and set the format of the file.
- Clipboard. Rows copied with Copy selected rows with header paste back with First row is a header switched on. Rows copied with Copy selected rows paste back with it switched off, because the import then maps the columns in the order of the grid. In a master-item screen, copy with the header.
Two messages are expected on the way back. The text columns of fields shown with their text are listed under Following columns could not be mapped:, because the import takes the key next to them. Columns set to Locked - keep target value are named in Locked columns are not imported, and existing rows keep their stored values there.
Troubleshooting / FAQs
1. The download icon does nothing, or the export entries are missing.
Export is switched off for that table. Suppress Export in the table properties disables the export functions, and only someone with access to Settings → Configurations can change it. See Table and column configuration in NextTables for SAP BW.
2. One column is missing from the exported file.
That column carries Suppress Export in its column configuration, which excludes the field from all exports. The setting is per column, so the rest of the table exports normally.
3. My export has fewer rows than the table in SAP BW.
The export carries what the grid holds. Two things reduce that: the filters you have applied, and Max Rows in the table configuration, which caps how many rows are read. Hover the row limit field in the toolbar to see both numbers at once, and raise the number there to load more rows.
4. The pasted rows have no column headers.
You used Copy selected rows. Use Copy selected rows with header instead, which puts the header line in front of the data.
5. The pivot shows the groups but no numbers.
Nothing is in the Values zone yet. Drag a numeric field into Drag here to aggregate, then set the aggregation with Value Aggregation in that column's menu.
6. I dropped a field into Column Labels and the table became very wide.
Every distinct value of that field becomes a column. Pick a field with few values, or filter the table first so the field has fewer values to spread. The table scrolls sideways in the meantime.
7. Does building a pivot change the data in SAP BW?
No. Pivot mode changes how the table is displayed to you. The stored rows are untouched, and switching the mode off shows them again.
8. Can I export the summary rather than the underlying rows?
Yes. An export follows the current display, so exporting while pivot mode is on gives you the summarized table.
9. A script that reads our CSV exports cannot read the dates or the numbers.
The CSV export is written in the format of the Import block of the user who exports. Adjust the script to that format, or set the Import block of that user to the format the script expects, for example YYYY-MM-DD, a point as decimal separator and a comma as delimiter. The block also decides how that user's imports are read.