
Collect, maintain, and monitor ESG data on the platform you already run
Twenty subsidiaries type their figures into a grid that checks each value before it saves, straight into the tables your platform already holds. The merging by hand is over.
From twenty spreadsheets to one table

Your subsidiaries submit where they already work
It looks like the spreadsheet they use now, with the rules built in.

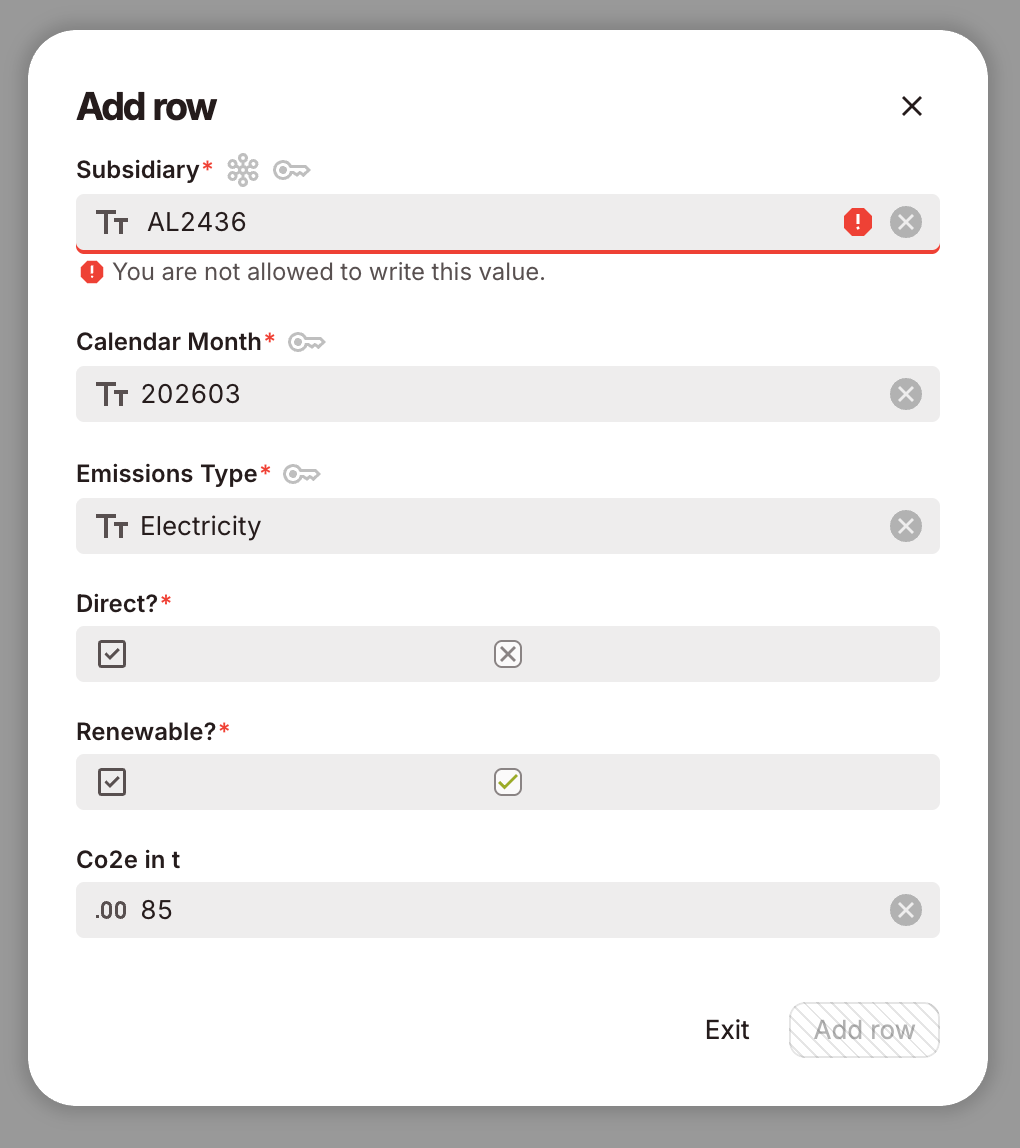
The rules catch mistakes before you do
A wrong unit or an unknown code stops at the subsidiary that entered it.

You watch the cycle close
Each submission reaches your dashboard as it is saved, and by mid-month you know who is missing.
A typical month, before and after
You send a template to twenty or more subsidiaries, and the files come back one at a time. Then you merge them by hand, hunting for gaps and wrong units.
Each subsidiary enters its figures in the grid, and only clean rows get through. The numbers are on the platform straight away.
Find the right value by typing its name
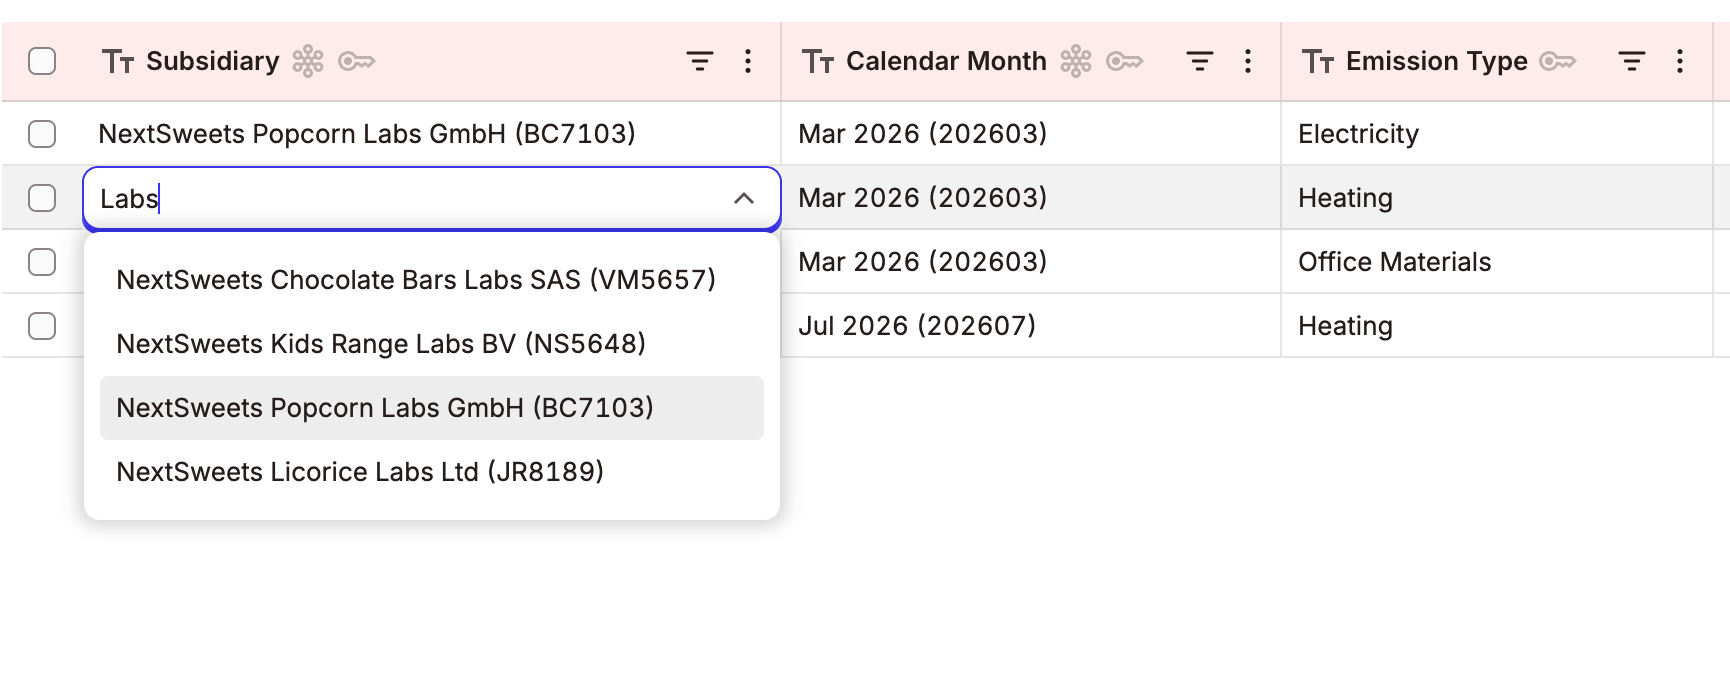
Type “Labs” and the field offers “NextSweets Popcorn Labs GmbH (BC7103)”. Your subsidiary picks the name it knows, and the code travels with it.
- Work in a familiar grid: filter and sort to find your own rows
- You pick “Mar 2026”, and your platform stores 202603
Only values that pass the rules reach the group total
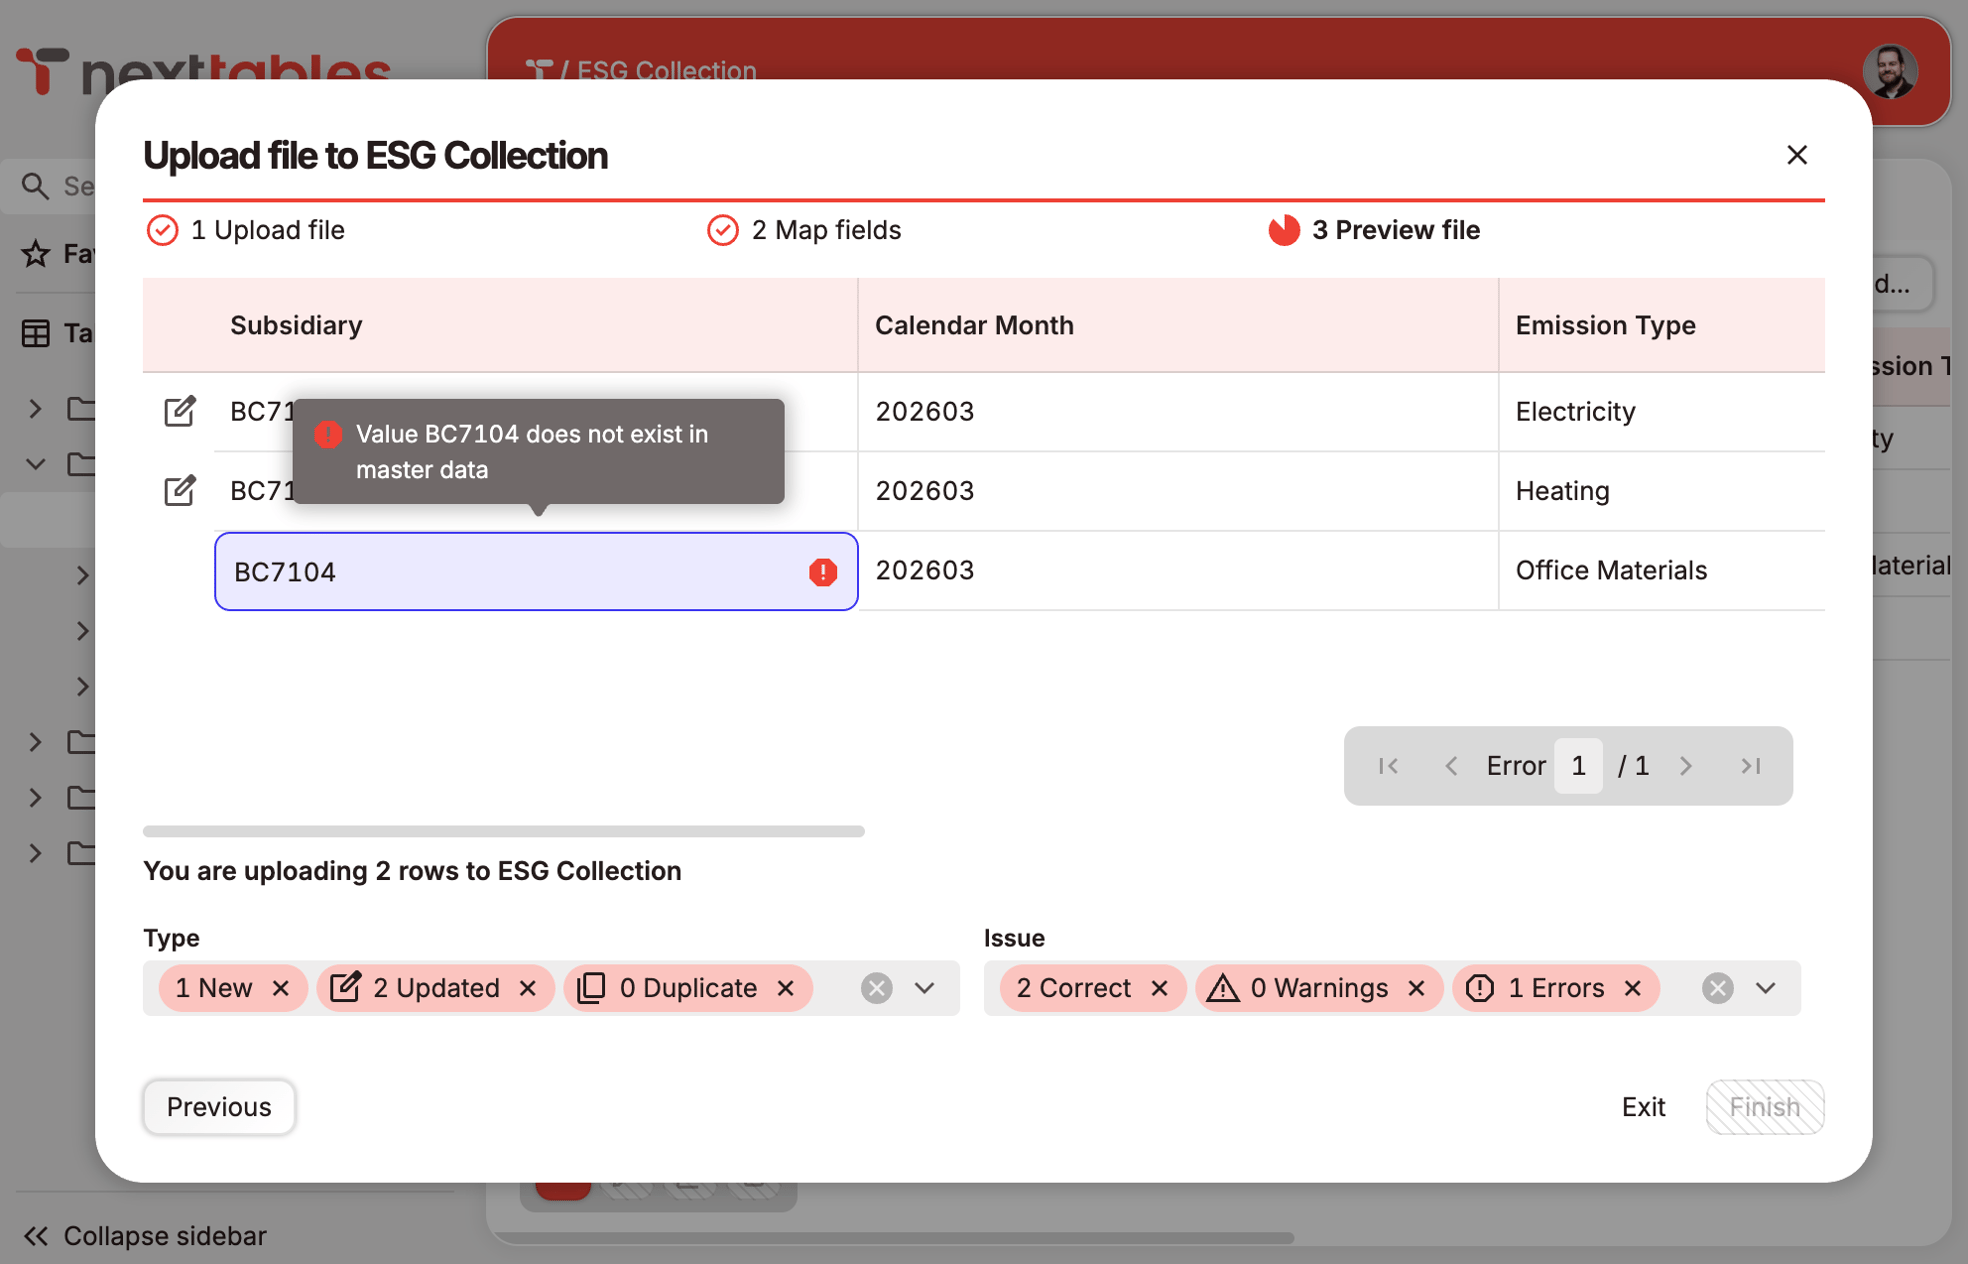
NextTables compares every entry with the reference data that already lives on your platform. A wrong value stops in the row someone typed it into, and it is fixed by the person who entered it, in the same sitting.
- Fields that need kWh take kWh, and required fields stay required
- Company codes and emission factors match the lists on your platform
- Drop in an Excel file for a whole location: mapped, checked, and as safe as a fresh entry
- The upload catches a duplicate for the same subsidiary and month
- Only the months you have opened accept data, because the calendar list is master data too
See how the cycle is going, and where it stalls
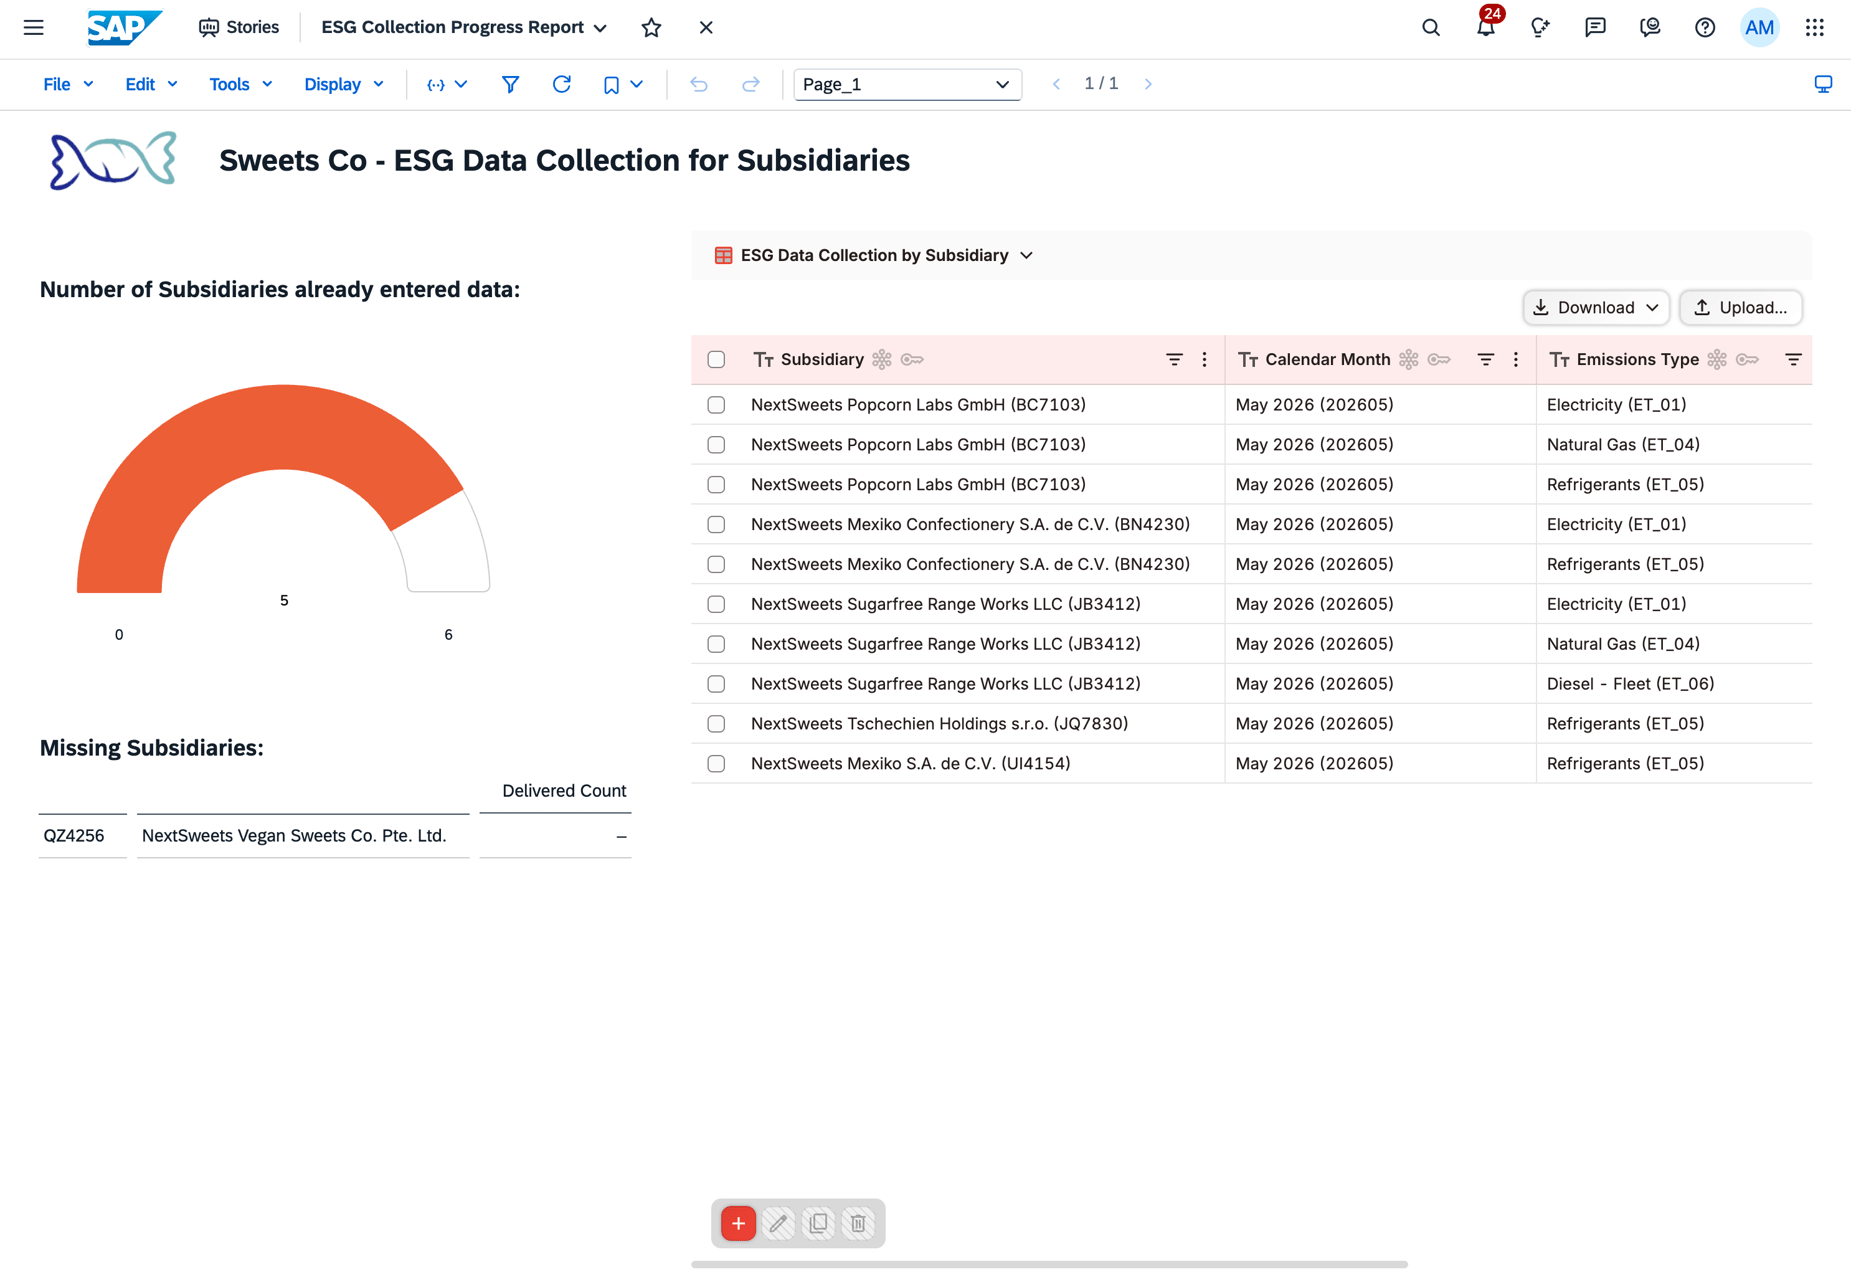
Every submission lands on the platform the moment someone saves it. Your dashboard counts them against your own list of subsidiaries, so eighteen in and two still open is a number you can see today, rather than after the deadline.
- Compare periods to spot the parts of the group that run late every cycle
- Chart it in SAP Analytics Cloud, Power BI, Tableau, or any tool you already use
- Add your own tracking fields, such as an owner and a due date, in the same app
- Scheduled jobs and pipelines read the same current rows, so nothing waits for a refresh
- Embed the NextTables app beside that chart, so chasing and fixing happen in one view
Add a field mid-cycle, and collect it the same month
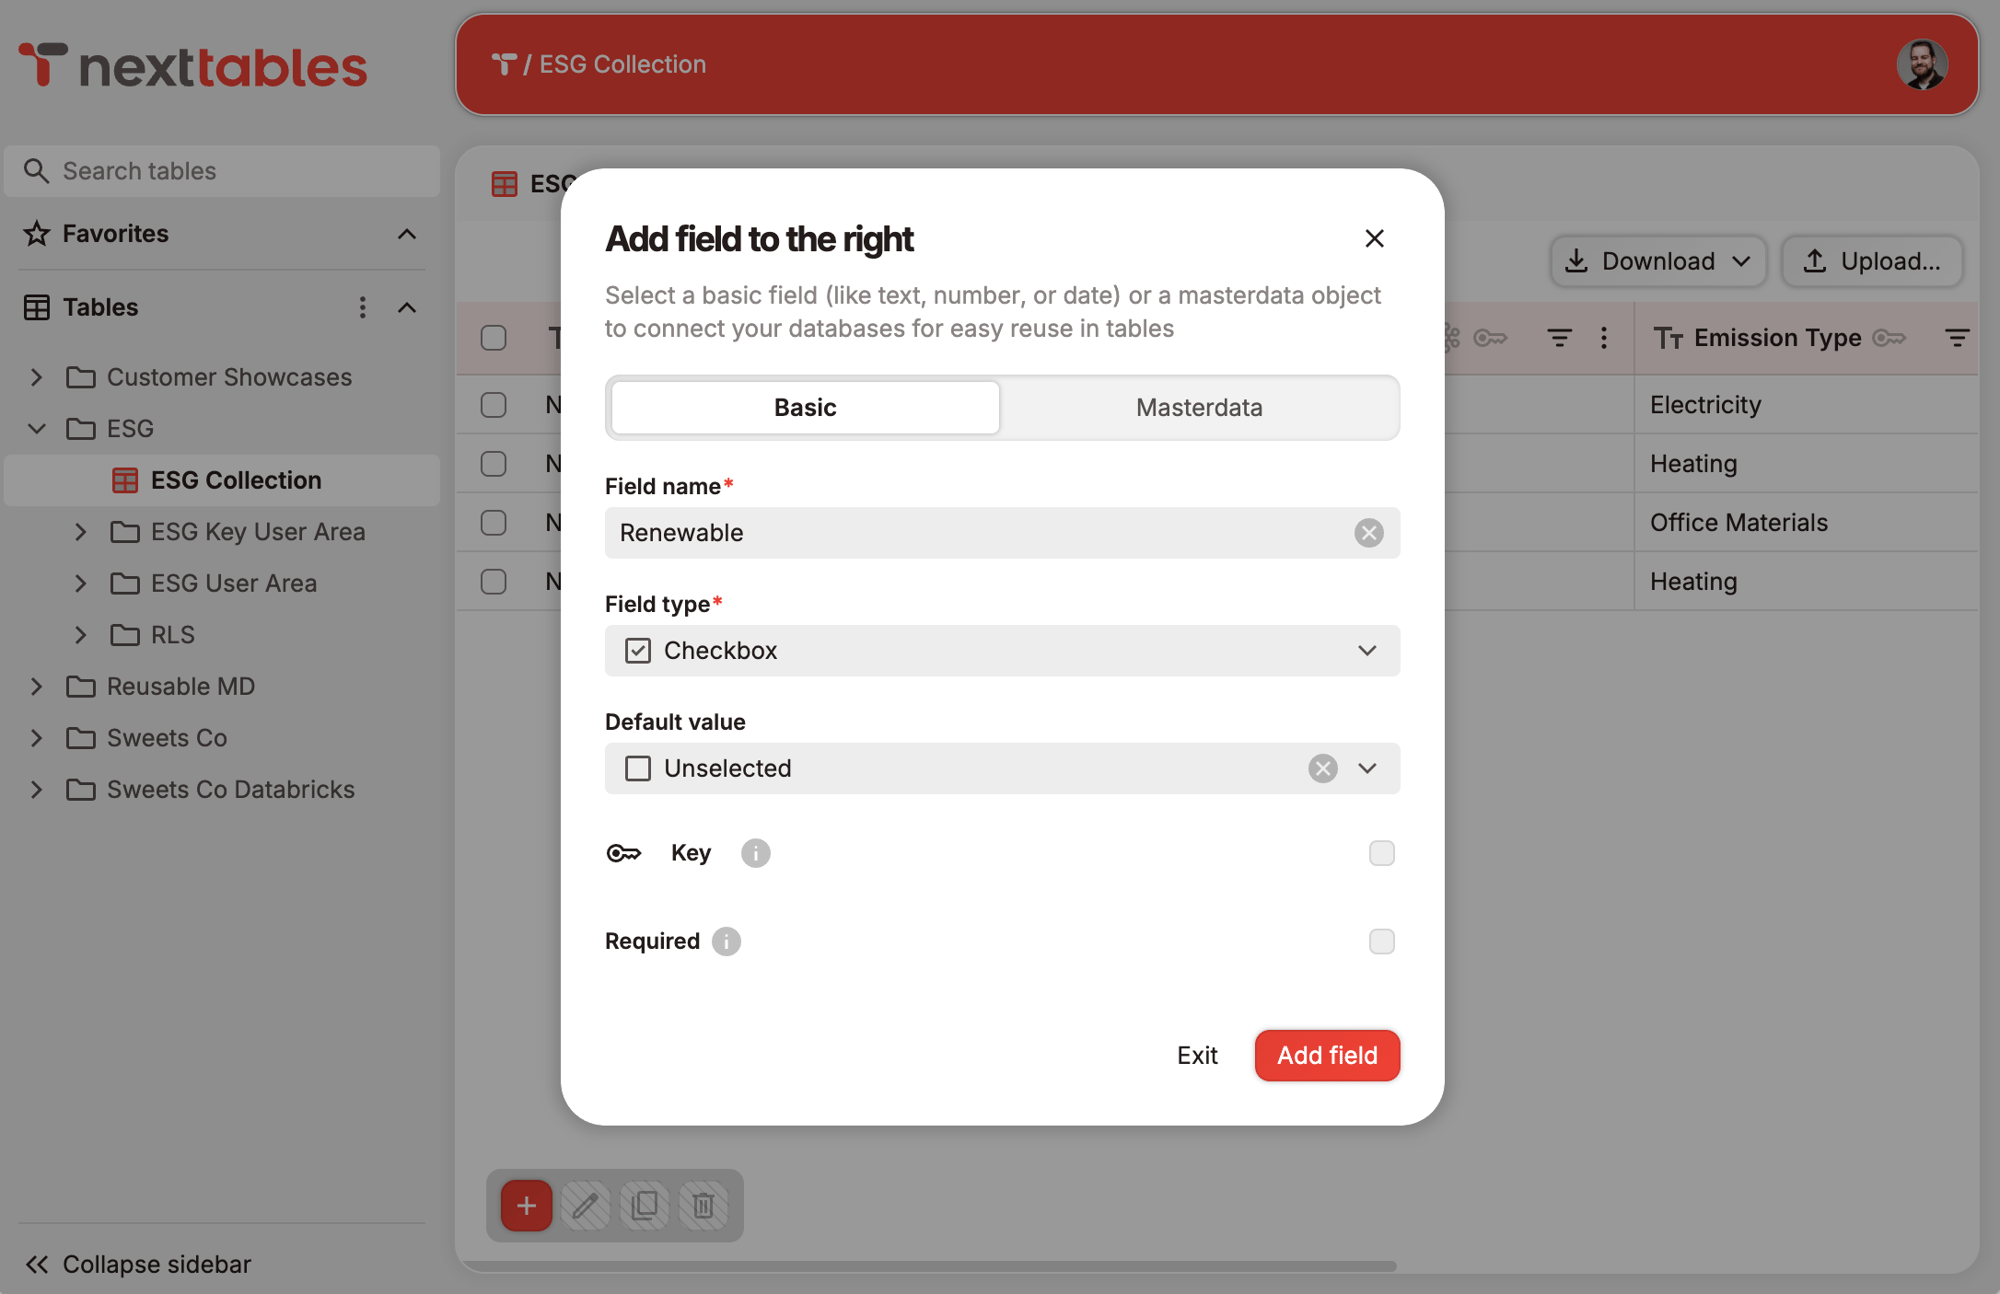
Your data team sets it up once: the folder, the connection, and the lists every value must match. After that you move at your own pace. Add a field halfway through the month, and your subsidiaries fill it in on their next submission. The same rules apply to everyone, so every change lands clean.
- Add a field, a unit rule, or a factor reference from the same screen
- A new field adds a column to your own table, so everything built on top of it keeps working
- Set up a whole new collection app in hours, then embed it in your dashboard
- Coming SoonAI is designed to help build and change apps, with your confirmation on every change
Each team edits only the rows that belong to it
You decide which subsidiary sees which rows, and who may edit them. Twenty teams work in the same table, and each one sees only its own part of it. So you can hand the app to the whole group from day one.
- One subsidiary, a region, or the whole group: the scope follows the person
- Reuse an access table you already keep on your platform, or hold the rules in NextTables
- Open the row behind any figure: subsidiary, period, and emissions type sit beside the value
- Your tables stay yours, so you can drop NextTables and keep every row
- Coming SoonApprovals, a full audit trail, and safe rollback are designed to complete the picture: a review before a change lands, a record of who changed what, and a way back
Built for the stack you already run
Your business data stays there.
SAP Business Data CloudDatabricksPostgreSQLSnowflake · Coming SoonMicrosoft Fabric · Coming Soon
See NextTables on your ESG data
Book a personalized demo, or start with the deck.
Frequently asked questions
NextTables looks like a spreadsheet with rules built in. Subsidiaries open the grid, see only the rows and fields that apply to their entity, and submit. Whether the reporting framework is CSRD/ESRS, GRI, SASB, TCFD, or an internal group standard, the fields and validation rules are configured once in NextTables and applied to every submission. Excel workbooks upload through NextTables as well, and every row is checked against the framework's rules before it lands on the platform.
Every submission lives on your enterprise data platform at all times, in tables that stay yours. NextTables holds only configuration metadata: framework templates, validation rules, and per-entity access definitions. If you stop using NextTables, your submissions are already in your tables and remain readable and editable by every tool connected to the platform.
NextTables runs directly on your enterprise data platform. Submissions land as rows in tables defined inside the platform itself. Your data stays on the platform at all times; NextTables writes into the existing tables, and every BI tool already connected reads the same rows the moment they are saved.
Sign-in goes through your enterprise SSO (for example Microsoft Entra ID or Google Workspace). Permissions are set at the row level on the platform itself, so each user sees only the rows their scope allows: one entity, a region, or the full group. Because access is enforced by the platform, the same boundaries apply to every tool reading the same tables.
You pay for the people who maintain data and the tables they maintain, so your cost matches your real use. See pricing to work out your own figure, or ask for a written quote on the same page. The trial is free for 60 days, with no credit card required.