NextTables lets finance maintain the reference data its management reports run on
Cost center mappings, reporting unit rules, hierarchies, and access tables sit in a familiar grid on SAP Business Data Cloud (Datasphere) or Databricks, where your reports already read them. Value help finds every value by name, each entry is checked against your master data, and NextTables keeps an audit log.
What your controllers can do from day one
Find each value by name
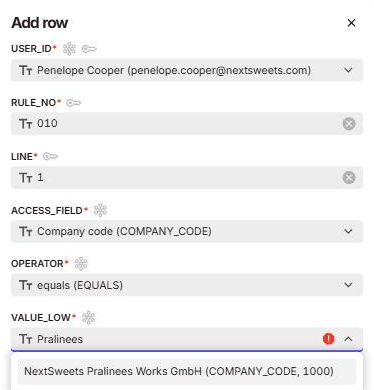
Value help searches cost centers, accounts, and company codes by name and fills in the matching code from your master data.
See the change in the next report
Each saved row goes straight to SAP Business Data Cloud or Databricks, and your management reports read it on their next refresh.
Edit your own rows, with an audit log behind them
Row-level authorization gives each controller the rows of their own company codes, and NextTables keeps an audit log.
Where does your cost center mapping live today?
Most finance teams keep it in one of three places, and each place works until the auditor asks a question or the organization changes.
A workbook
One person updates the mapping in Excel, and the platform sees the change with the next upload, together with everything else that changed since the last one.
Table maintenance in the ERP
SM30 views and configuration apps keep the table inside the ERP, where each change goes through a transport and an authorization that covers the whole table.
The platform's table editor
The editor in the data platform serves the people who build the data model, so finance sends every change to the data team as a ticket.
NextTables gives the table a fourth home on your data platform, where controllers maintain it in a grid with value help, checks at entry, and their own row scope.
Move a business unit in the hierarchy, and the P&L follows

Finance reorganizes its reporting copy of the cost center hierarchy for next year on the data platform, while the standard hierarchy stays in the ERP. Today's reports keep reading the current structure, and the reports on the new version roll up along the new one.
- Move whole branches, and the child nodes move with their parent
- Create new nodes and entire hierarchies for the views your reporting needs
- Every move of a node or a branch lands in the audit log


How a controller clears the Unassigned bar from inside the report
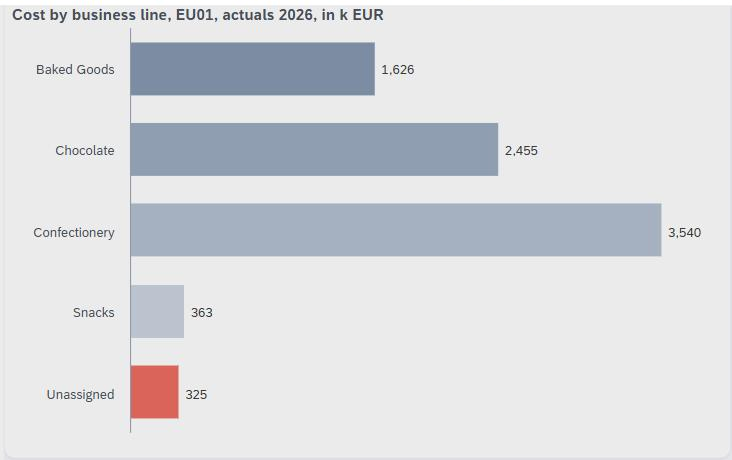
The cost overview shows 324,900 euros that still wait for a business line. The controller opens the mapping table embedded in the same dashboard, assigns each cost center whose business line is clear, and the bar shrinks on the next refresh.
- Embed the app as a web object in SAP Analytics Cloud or in any BI dashboard that supports web objects
- Contextual filtering shows the controller the rows that belong to the current view
- One save reaches every BI tool, because all of them read the same platform
Three checks guard every row, typed or uploaded
A controller signs off a number only when the tables behind it are right, so NextTables checks each row before it is written, in the grid and in a file upload alike.
- Master data: each cost center, account, and company code must exist in the master data on your platform
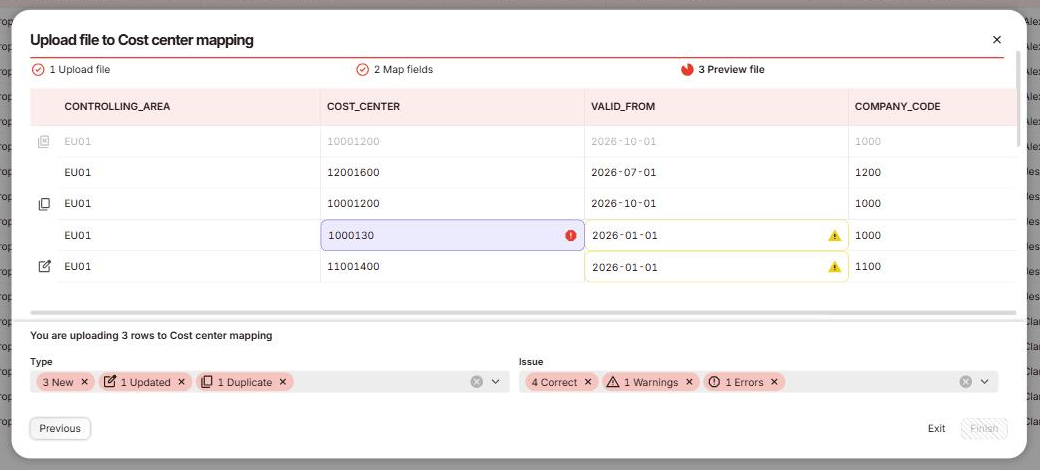
- Rules: an end date before its start date stops the row, and a valid-from date in a closed period draws a yellow warning in the upload preview
- Scope: each controller writes the rows of their own company codes
- Finish stays locked in the upload preview until every error is fixed


Your access table decides who sees which company codes
Access to finance data is a table, and finance maintains it like the mapping. Finance adds a line for the new controller, picks the company code by name, and the dashboard shows that scope on the next load.
- Search people by name, and the table stores the matching user ID
- Grant one company code, a range of company codes, or a profit center per line
- The data access control in SAP Datasphere reads the table and applies it to every story built on the model
Finance use cases on SAP Datasphere
Each walkthrough follows one table through Sweets Co, our demo group, from the grid to the report that reads it.
Controlling
Cost center mapping
Finance assigns each cost center a business line and an owner from a valid-from date, and the report reads the mapping month by month.
Controlling
Reporting unit rules
A rule table sends every cost line to its reporting unit, and the report lists the cost that still waits for a rule.
Controlling
Data access controls
Finance maintains who sees which company codes, and the data access control in SAP Datasphere applies it on the next dashboard load.
The same mapping change, before and after NextTables
Before NextTables
- Someone asks for the current mapping file, and three versions come back by email.
- A cost center code with a missing digit travels to the data team in Excel and fails the overnight load.
- The auditor asks who changed the mapping for company code 1200 in March, and the answer is a file's last-modified date.
With NextTables
- One table on the platform holds the mapping, and every report reads the same rows.
- The upload preview marks the mistyped cost center in red and holds Finish until the controller corrects it.
- The audit log on your platform answers the auditor's question.
Your finance data stays on the platform you already run
NextTables connects to SAP Business Data Cloud, Databricks, and PostgreSQL today, and it stores only its own configuration. Support for Snowflake and Microsoft Fabric is on the NextTables roadmap.







Pick the finance table for your demo
Tell us how finance keeps its cost center mapping, reporting unit rules, or access table today. We show you the same table on SAP Business Data Cloud or Databricks, with value help, checks at entry, and the audit log. If you prefer to read first, the deck covers the same ground.
Frequently asked questions
Yes, controllers maintain cost center mappings, reporting unit rules, access tables, and reporting hierarchies in a familiar grid, and every entry is checked against the master data on your platform. The data team sets each app up once and decides who edits which rows.
Your consolidation engine keeps the close: currency translation, eliminations, and the consolidation monitor. NextTables maintains the tables around it on your data platform, such as local-to-group mappings, grouping attributes, and supplementary data that teams upload from spreadsheets today.
Keep the tables the ERP needs for posting where they are, and your ERP and its configuration stay exactly as they are. The copy your reports read belongs on the data platform, where finance maintains it with value help and row-level scope, checked against the ERP structures replicated or federated there.
NextTables maintains data, and your planning tool runs the planning process. Finance uses NextTables for the reference data that plans and reports share, such as cost center mappings or the business line of a cost center that opened mid-year, checked at entry and available on the platform right away.
NextTables writes each change to the platform your BI tools already read, so SAP Analytics Cloud, Power BI, and Tableau show it on their next refresh. The apps also embed in any dashboard that supports web objects.
Your finance data stays on your data platform at all times. NextTables stores only its configuration: app definitions, validation rules, and access roles.
Where an MDM program owns a domain, that program stays the place to maintain it. NextTables covers the reference data outside MDM scope, such as the mappings and rule tables that live in spreadsheets today.
NextTables for SAP BW covers the same tables inside your SAP Business Warehouse (BW) system, and the page on NextTables for SAP BW shows how it works there.