

📝 Availability: NextTables for SAP BW, Professional and Enterprise editions.
You will learn
How to record a problem in NextTables as one file, what the file contains, and how it reaches your support contact. A support trace gives support the exact requests and answers of your session and the details of a server error, so a problem can be reproduced without a screen sharing session.
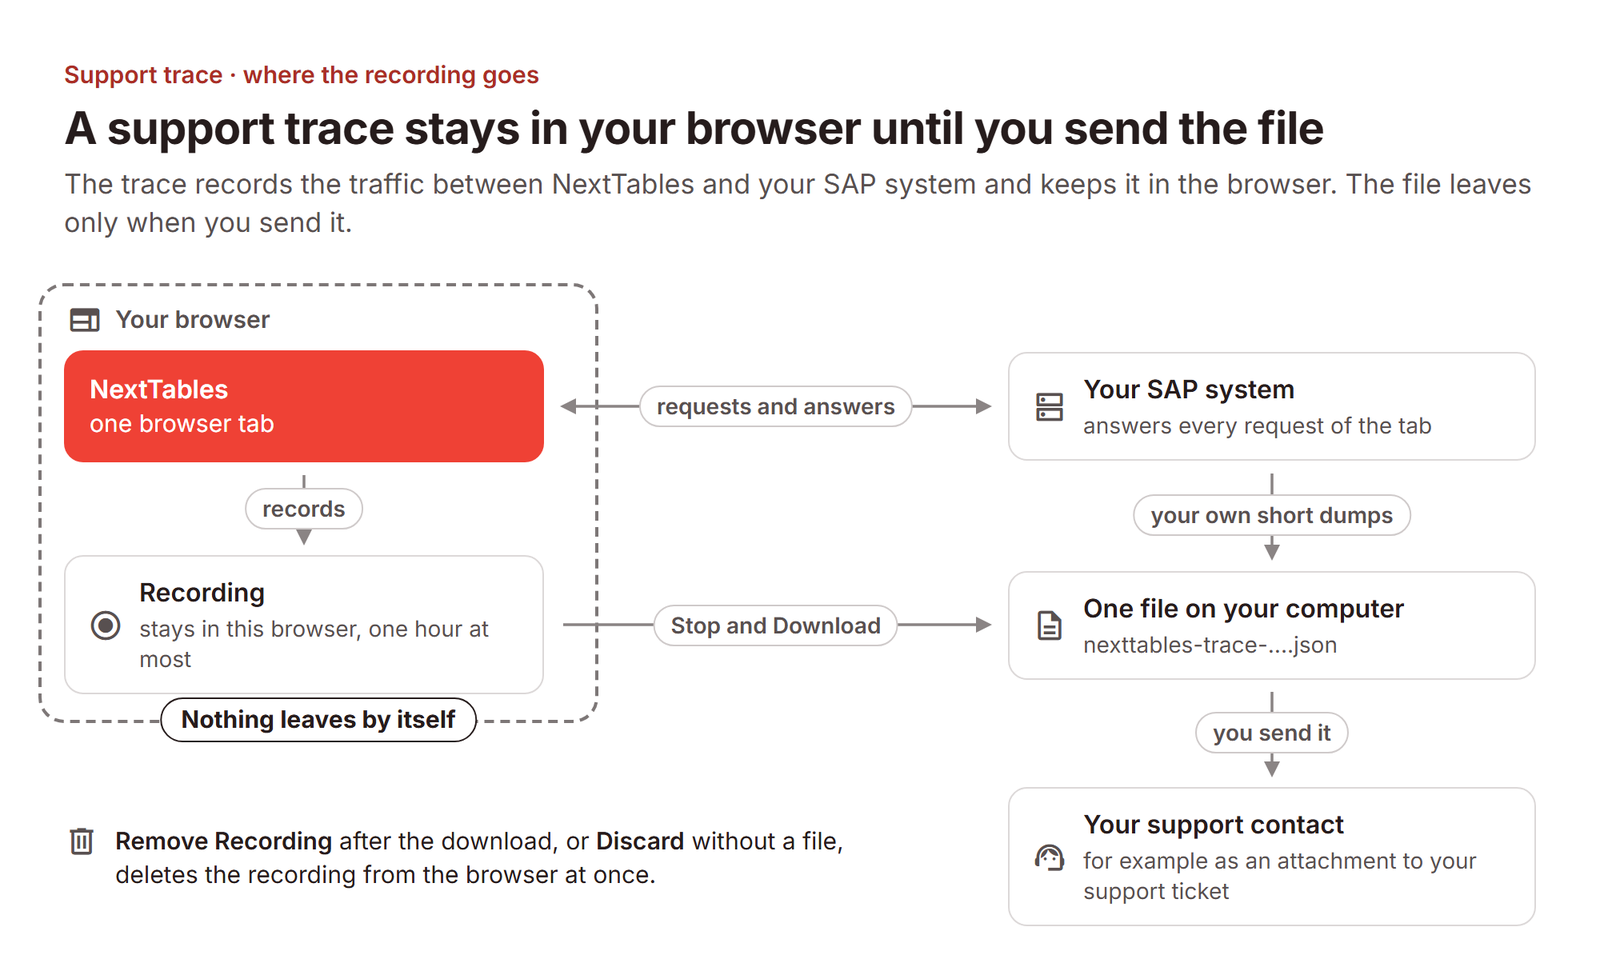
The trace runs in your browser and stays there. Nothing is sent automatically: you download the file and decide who gets it.
This article is for every NextTables user who reports a problem, and for the administrators who decide whether users may record traces.
Prerequisites
- Tracing is switched on for your system. It is on unless an administrator switched it off; see For administrators below.
- A problem you can repeat. The trace records only what happens while it runs, so you start it first and then repeat the steps.
- NextTables open with its menu. The button that starts a trace sits at the bottom of the menu, so a table opened without the menu, for example embedded in a dashboard as described in How to embed a NextTables table in SAC or Tableau, cannot start one.
Step-by-Step Instructions
1. Open the Event Log
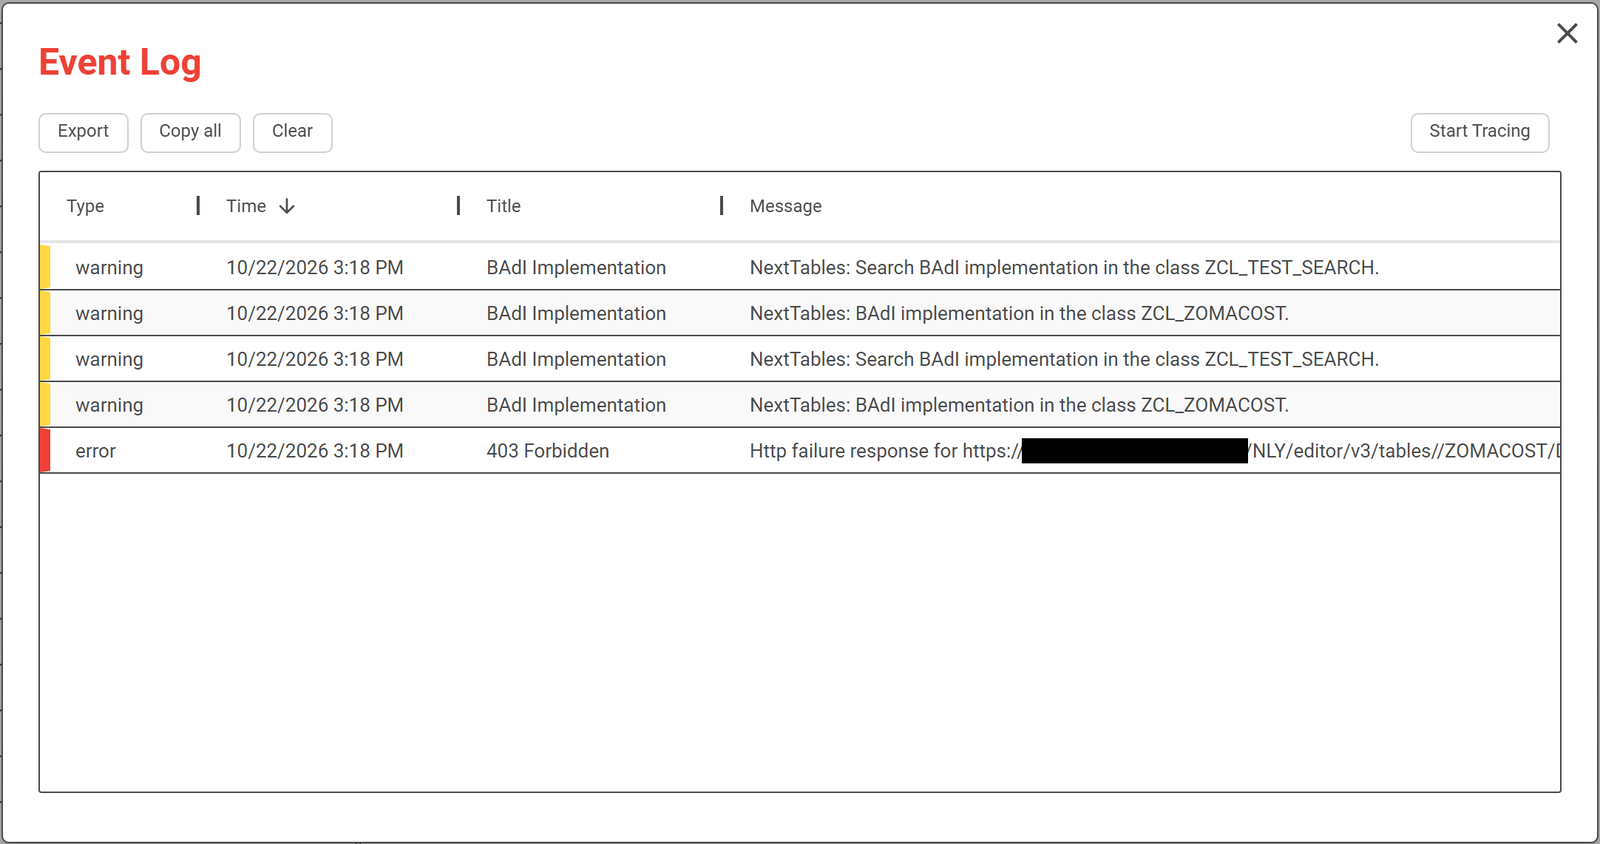
Click the round ! button at the bottom of the menu, next to the language buttons. Its tooltip reads Event Log. The Event Log lists the messages and errors of this browser, with Export, Copy all and Clear at the top left and Start Tracing at the top right.
2. Start the trace
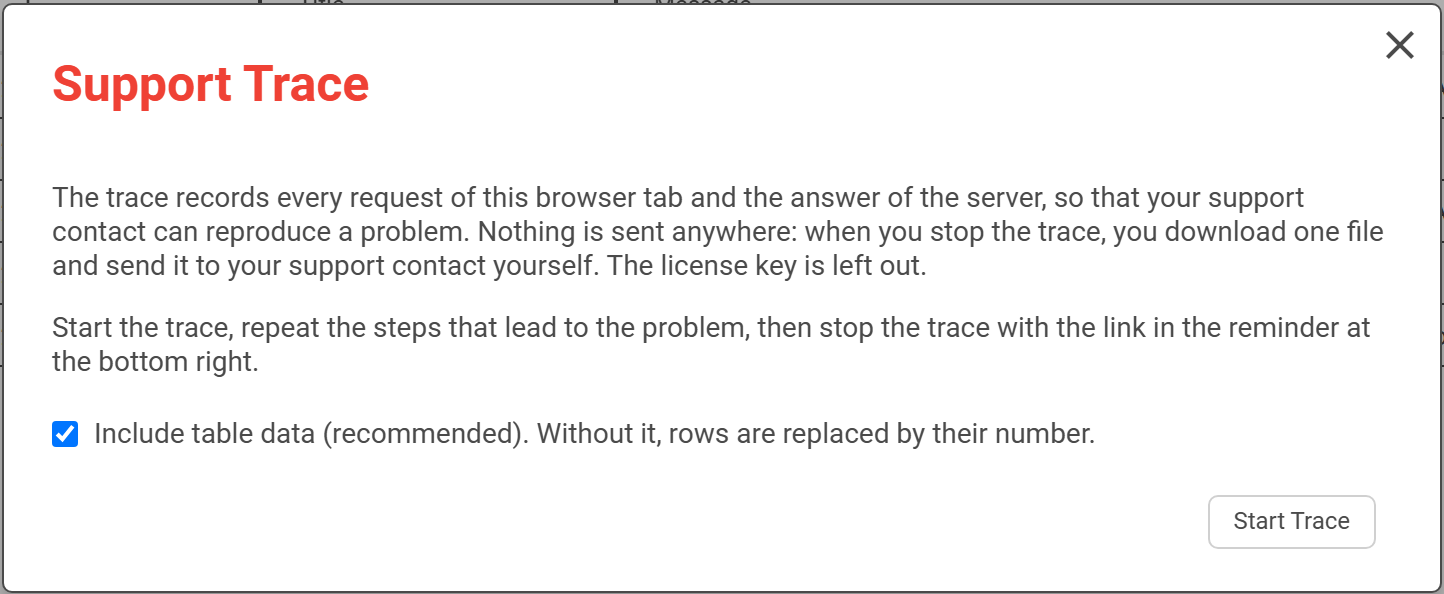
Click Start Tracing. The dialog Support Trace says what is recorded: every request of this browser tab and the answer of the server.
Decide whether table data is recorded. Include table data (recommended) is ticked, and many problems depend on the values in a row. Untick it when the table holds data that must stay in your company: the file then keeps the structure of every request and replaces the rows and long texts by their number or length.
Click Start Trace. A reminder at the bottom right shows how long the trace has been running and how large it is, for example Support trace is running (4 s, 20 KB).
3. Repeat the steps that lead to the problem
Stay in the same browser tab and do again what you did when the problem appeared: open the table, set the filter, change the row, press the button. If the server reports an error, close the message and continue; the trace has recorded it.
4. Stop the trace and describe the problem
Click here in the reminder, or Stop Tracing in the Event Log. The dialog Stop the Support Trace asks what you did and what went wrong. A few sentences are enough: the table, the row and the message you saw.
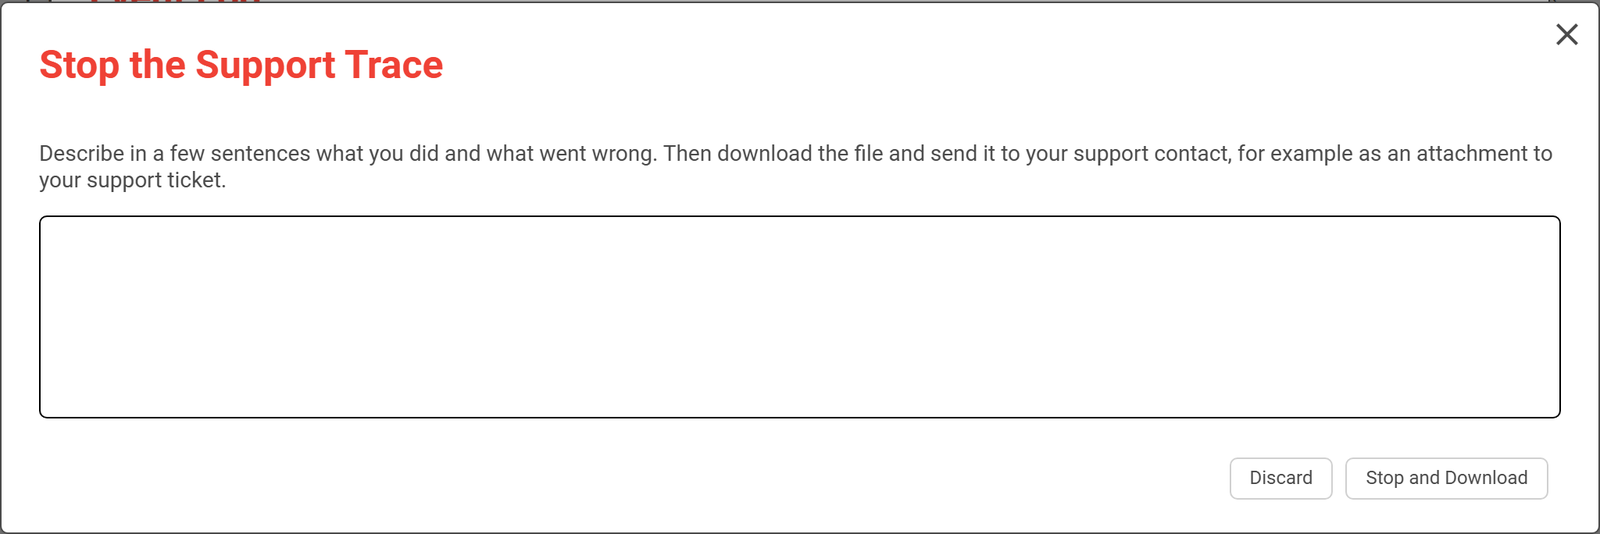
Click Stop and Download. Your browser saves one file named like nexttables-trace-ABC-100-20261017-091530.json, with the system ID and the client in the name. Discard ends the trace without a file.
5. Check the file and remove the recording
Check that your browser saved the file, then click Remove Recording. If the file is missing, Download Again creates it once more.
6. Send the file to your support contact
Attach the file to your support ticket, or send it to your support contact the way you usually do.
📝 Nothing is sent automatically. The recording stays in your browser until you remove it, and you decide who gets the file. Remove Recording after the download, or Discard without a file, deletes it from the browser. A recording nobody removes is deleted after one hour, and Clear in the Event Log deletes it as well.
What the file contains
| Part | Content |
|---|---|
| Header | Your description, the frontend and backend version, system, client, user, language, browser, start and stop time, and whether table data was recorded. |
| Requests | Every request of the browser tab to the SAP system with time, method, address, status, duration, the request and the answer. For a failed request, the complete answer the server sent with the error. |
| Messages from the server | The messages that reached the browser tab over its live connection while the trace ran, for example about locked rows or the status of an import. |
| Short dumps | The short dumps the SAP system wrote for your user in your client while the trace ran: runtime error, exception, short text, program, include, line and call stack. Variable contents are never included; the short text shows a placeholder where a value would stand. |
The license key and the system token are masked in the file. An answer larger than 2 MB is shortened to its first and last 100 rows, and the entry says how many rows were removed. An error answer is cut at 2 MB, with a note on how much is missing. Once a trace reaches its size limit of about 100 MB, it records only the method, address, status and duration of each further request, and the reminder says so.
Two things are outside the trace. Files that open in a new browser window, such as a file stored in a row or the validation log of an import, are downloaded without it. And the first two requests NextTables sends while the page loads, which read the application settings and your user profile, run before a trace can record them: after a reload during a trace, the file lacks these two.
When the server reports an error
An unexpected error on the server, for example a short dump, opens a dialog titled Error. Its text tells you where to turn:
| Situation | What the dialog says | What to do |
|---|---|---|
| The short dump happened in an enhancement of your company, for example a BAdI implementation whose name starts with Z or Y | The error occurred in your company's enhancement ZCL_MY_BADI. Please ask your SAP developer; details are in transaction ST22. | Ask your SAP developer. The cause is in your company's code, and the developer finds the details in ST22. |
| Any other error on the server | An unexpected error occurred on the server. Your SAP administrator finds the details in transaction ST22. If the cause is in NextTables, record a support trace: open the Event Log (!), choose Start Tracing, repeat the steps and stop the trace to download the file. | Ask your SAP administrator first. If the cause is in NextTables, record a trace as described above. |
| The same error while a trace runs | An unexpected error occurred on the server. The running trace has recorded it; the details of the server are added when you stop the trace and download the file for your support contact. | Finish the steps, then stop the trace and download the file. |
| Tracing is switched off for your system | The first two sentences of the second row | Ask your SAP administrator. |

Outside a trace, the Event Log keeps one line per failed request with its status and the beginning of the server's answer. That line is a first hint; the trace file holds the complete answer and the short dump.
If the file holds no short dump although the server reported an error, ask your SAP Basis team for the short dump of your user at the time of the error. They find it in transaction ST22 and can save it as a file to send along with the trace.
For administrators
Enable Tracing Feature under Settings → App Settings switches tracing on or off for all users. When it is off, Start Tracing in the Event Log is grayed out and its tooltip says that an administrator disabled tracing, the error dialog of a server error points only to the SAP administrator and ST22, and the SAP system hands out no short dumps for a trace.
A user only ever receives their own short dumps, in the client they are logged on to. Reading them needs no ST22 authorization, and the file never contains variable contents of a dump.
Troubleshooting / FAQs
1. Start Tracing is grayed out.
An administrator switched tracing off for the system. See For administrators above.
2. My browser did not save the file.
Click Download Again before you click Remove Recording. The recording stays in the browser for one hour at most.
3. I reloaded the page while the trace was running.
The trace keeps running and keeps the requests from before and after the reload. Only the two requests NextTables sends while the page loads are missing from the file.
4. The server reported an error, and my support contact finds no short dump in the file.
Ask your SAP Basis team for the short dump of your user at the time of the error. They find it in transaction ST22 and can save it as a file.
5. Does the file contain our business data?
With Include table data ticked, it contains the rows of every table you opened during the trace, as the server sent them. Untick the option at the start when the data must stay in your company. The license key and the system token are masked either way.
6. Is the export of the Event Log enough for support?
The export holds one line per message, with type, time, title and message. The trace file holds every request and answer and the short dumps of your user, which is what support needs to reproduce a problem.
7. Can another user's data end up in my file?
A trace belongs to the browser tab it was started in, and the SAP system hands out only the short dumps of your own user in your client.