Self-service data maintenance for business teams, in a familiar grid with guided entry
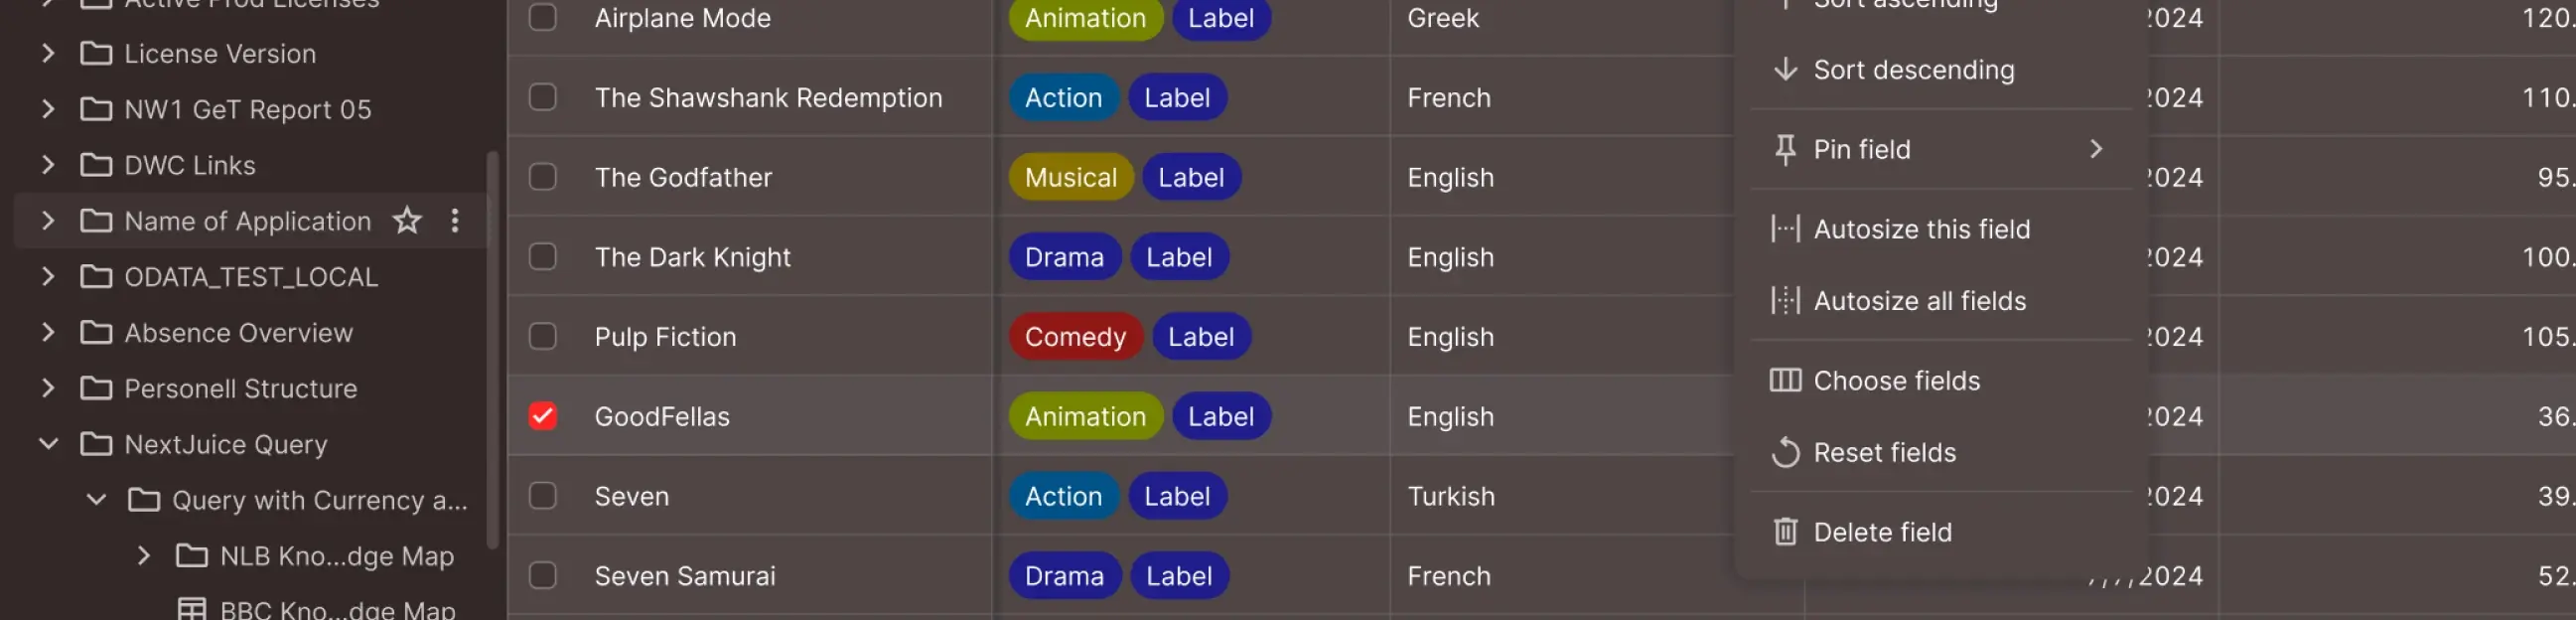
A familiar grid: filter, sort, copy, paste and import
Spreadsheet-like editing, on the platform
Business users edit directly in the table, with keyboard navigation and bulk changes that feel like the spreadsheet they came from. Every edit lands on the enterprise data platform, checked first.
Upload a file to update or overwrite rows: keys match existing records, and duplicates inside the file are flagged before anything is written.
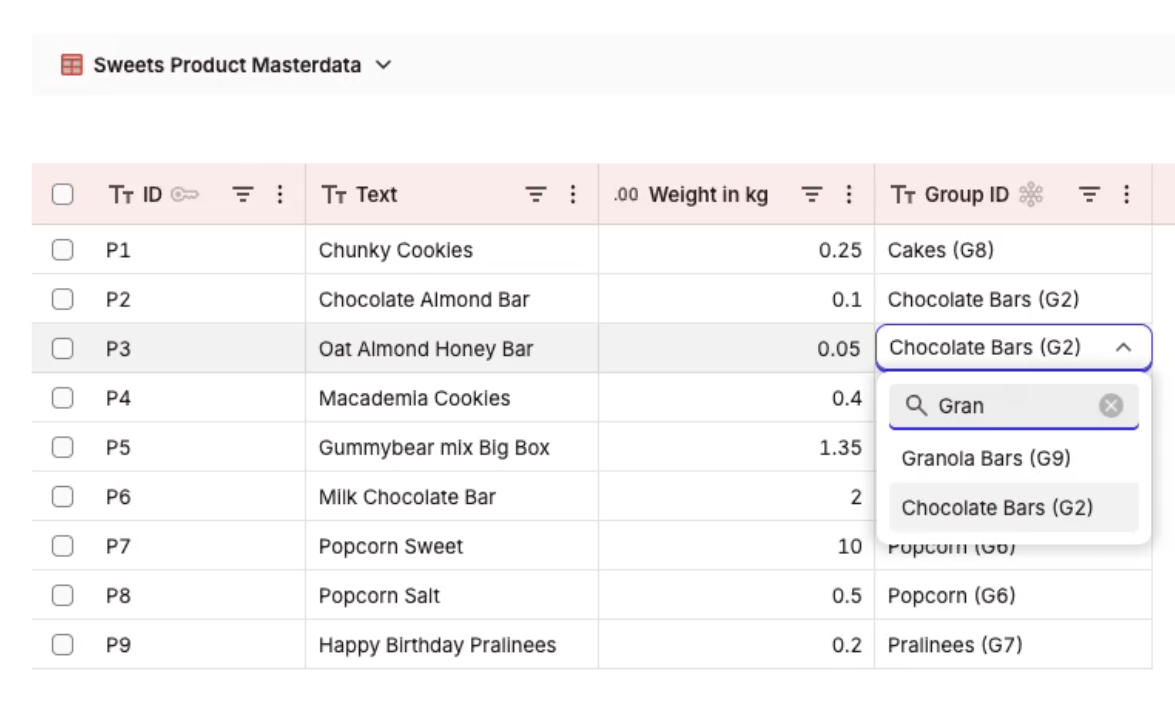
Guided entry with search against your master data
Key and text side by side
People see the key and its text together, so they choose what they mean instead of remembering a number. The list comes from your master data at the moment of entry, live through the connection.
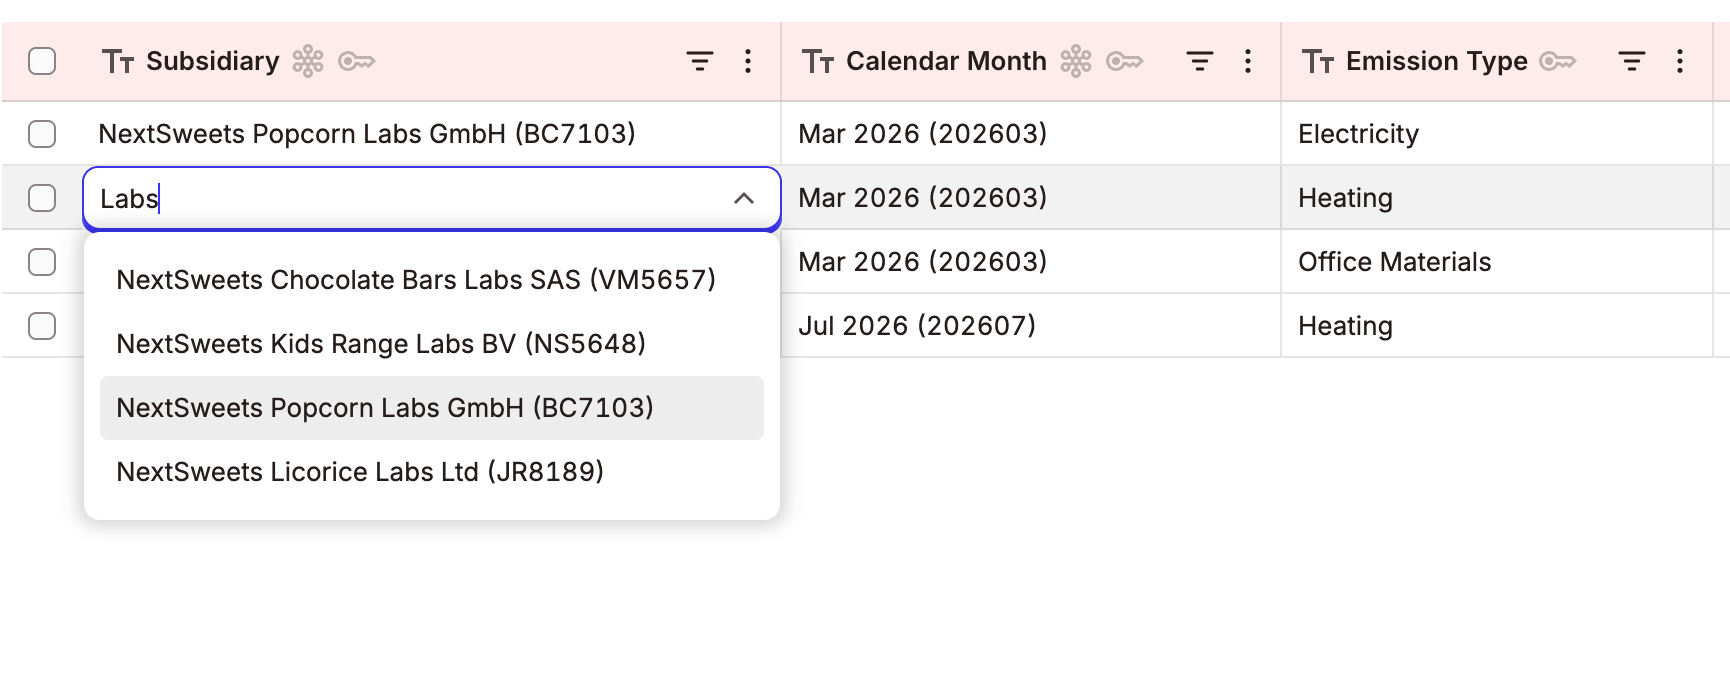
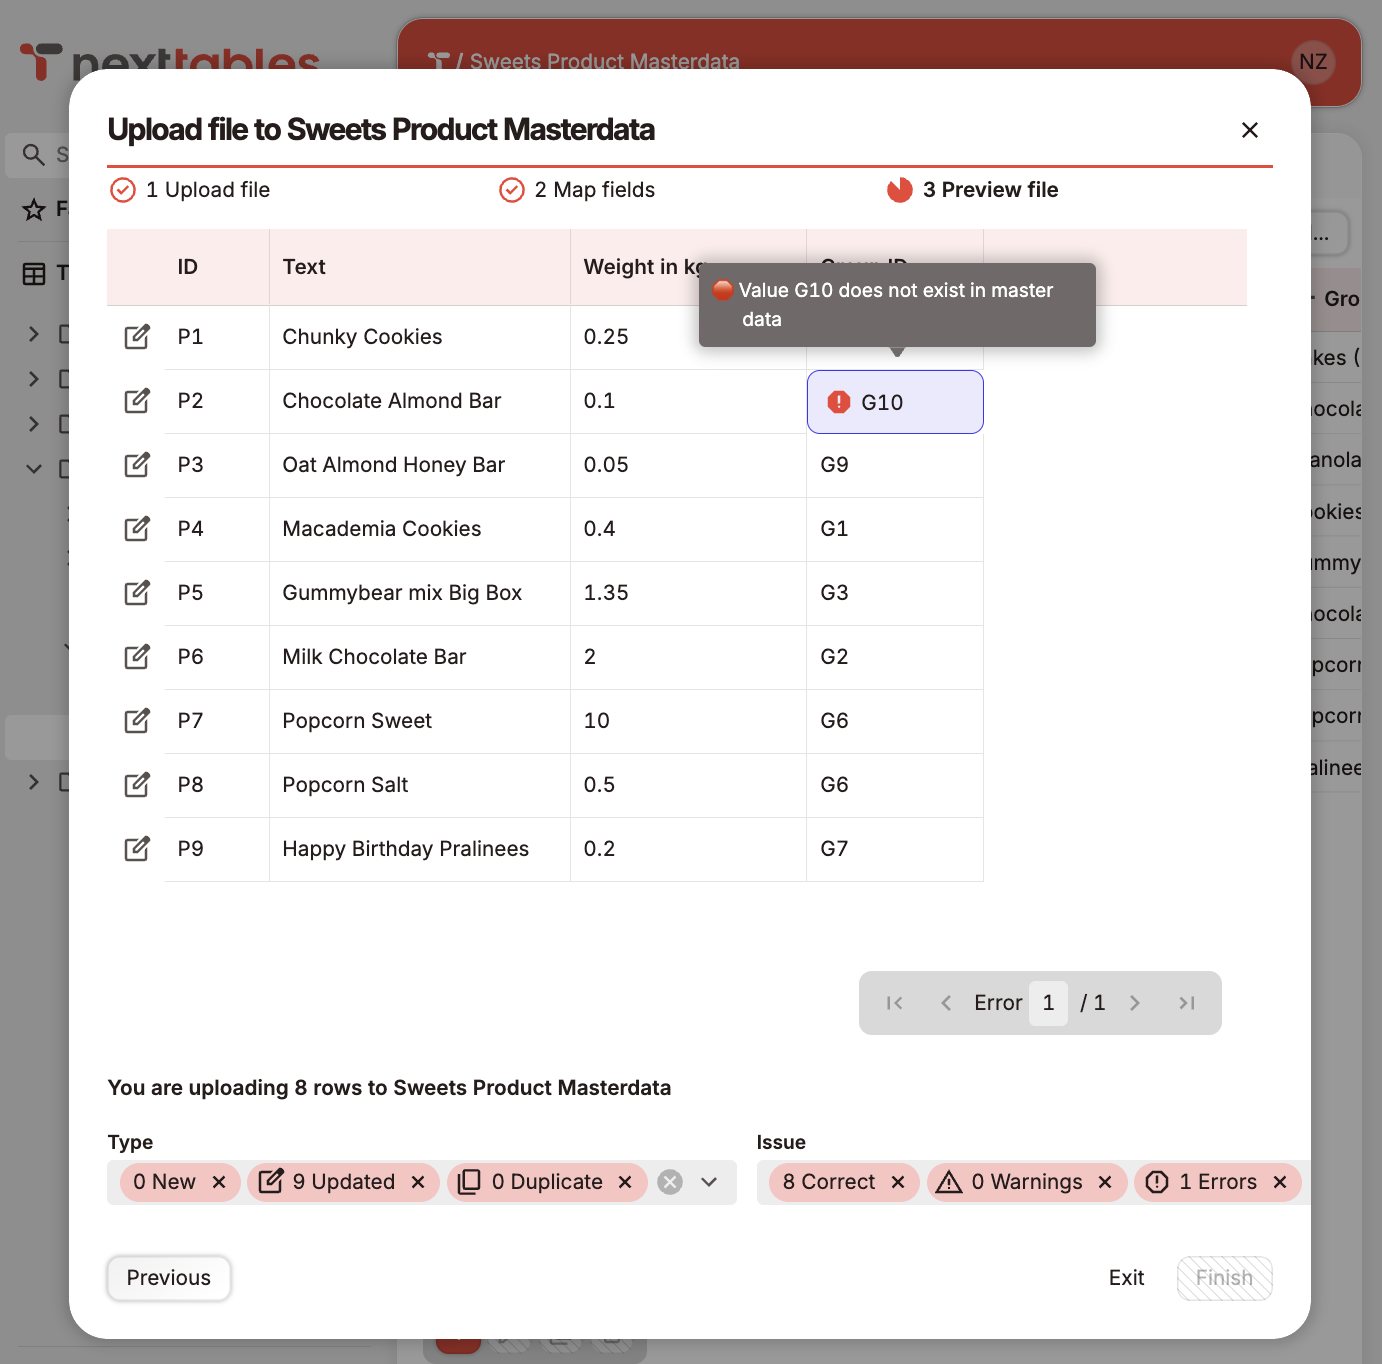
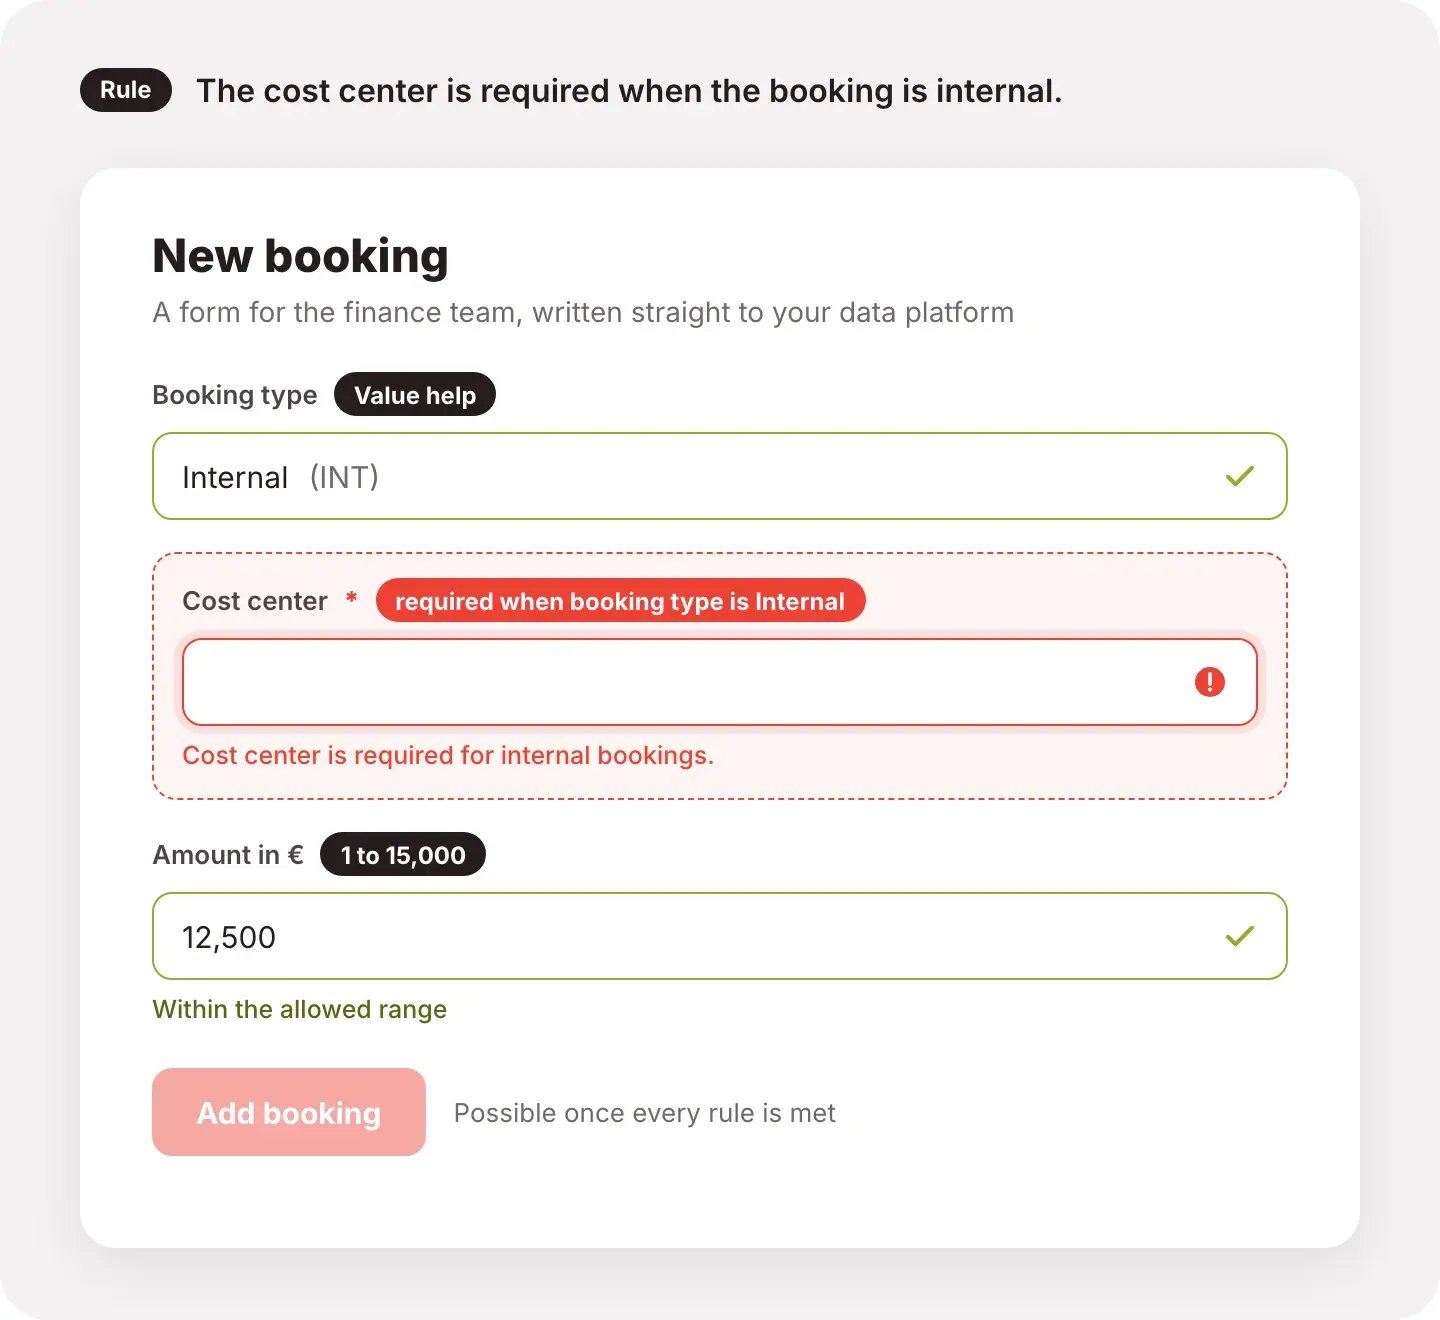
Validation feedback while the person is still in the field
Validation runs while the person is still in the field, so the message goes to the one who can fix it, at the moment they can fix it. Only validated values reach the platform. How rules are defined and enforced on every channel: Governed.
Intelligent forms with conditional logic and validation
Configured once, enforced everywhere
A rule written for the form applies to inline editing, file imports and API writes too, with the same message in each. A built-in expression layer handles calculations, conditions and derived values, so a collection like ESG reporting stays a form instead of becoming a development project.
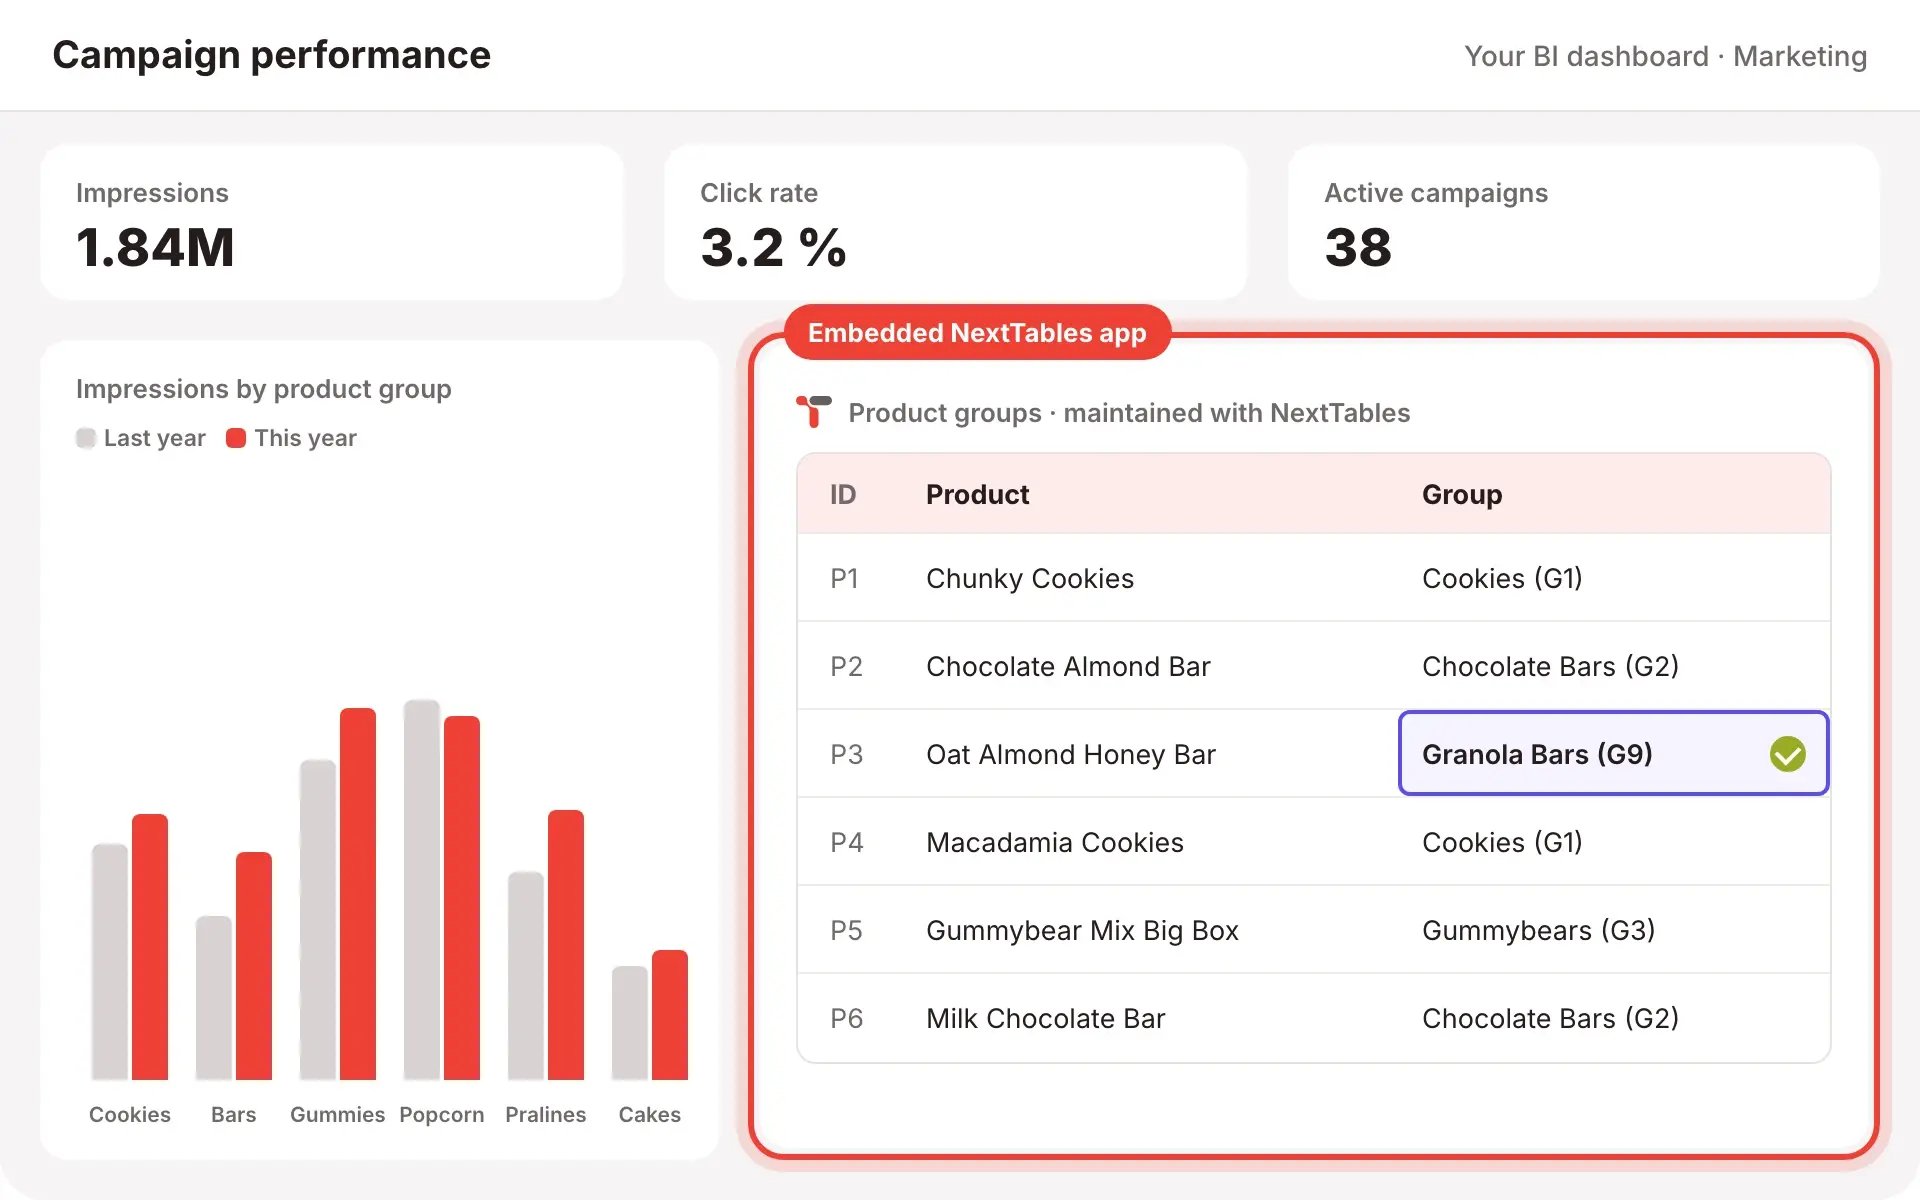
Embedded in SAP Analytics Cloud, Power BI and Tableau
The dashboard's context filters the rows
The same validation, authorization and audit log apply whichever BI tool hosts the app, so the experience stays the same when the BI landscape changes. Embedded mode is available today; a native SAP Analytics Cloud widget is on the way. Coming Soon

One app across platforms


Validate here, write there
HR reference data in SAP Business Data Cloud serves as the validation source for classifications written to Databricks. One interface for the team, one set of rules across the boundary.
Native on each platform
SAP Business Data Cloud (Datasphere), Databricks and PostgreSQL are generally available. Snowflake and Microsoft Fabric are on the roadmap. The platform pages carry the architecture: SAP Business Data Cloud, Databricks.
One sign-in, through your identity provider
People sign in through your identity provider. The platform connection runs on one technical user, so maintenance-only users stay outside the platform's user management and licensing.
From data entry to the BI report, built by your own team
Create the table
A key user defines fields, types and which master data backs them. The table is created on the platform, in the schema your administrator scoped.
Maintain it in the grid or a form
Editors work in the grid, in the form or by upload. Validation and value help come with the field definitions, so each rule is built once.
See it in the report
The maintained table is available to your models and dashboards at once. The full cycle stays with the people who own the process.
Frequently asked questions
The grid works like the spreadsheet they know: filtering, sorting, copy and paste, bulk updates, file import. Value help and validation guide the entry itself. Most teams are productive on the first day.
SAP Analytics Cloud, Power BI, Tableau, and any tool that supports web objects. The embedded mode shows the grid alone, and the dashboard's context filters the rows.
Yes. Excel stays an input: edit offline, upload through NextTables, and every row is validated before it is written. Keys match existing records and duplicates are flagged.
They sign in to NextTables through your identity provider. The platform connection runs on one technical user, so maintenance-only users stay outside platform user management.
Key users in the business team, in configuration rather than code: fields, master data, rules, roles. Where a rule needs logic, the built-in expression layer carries it.
As a subscription for NextTables Cloud, sized by users and tables. The details are on the pricing page.
See it with your own tables
Half an hour on your data, in your BI tool. Or take the deck to the team first.